
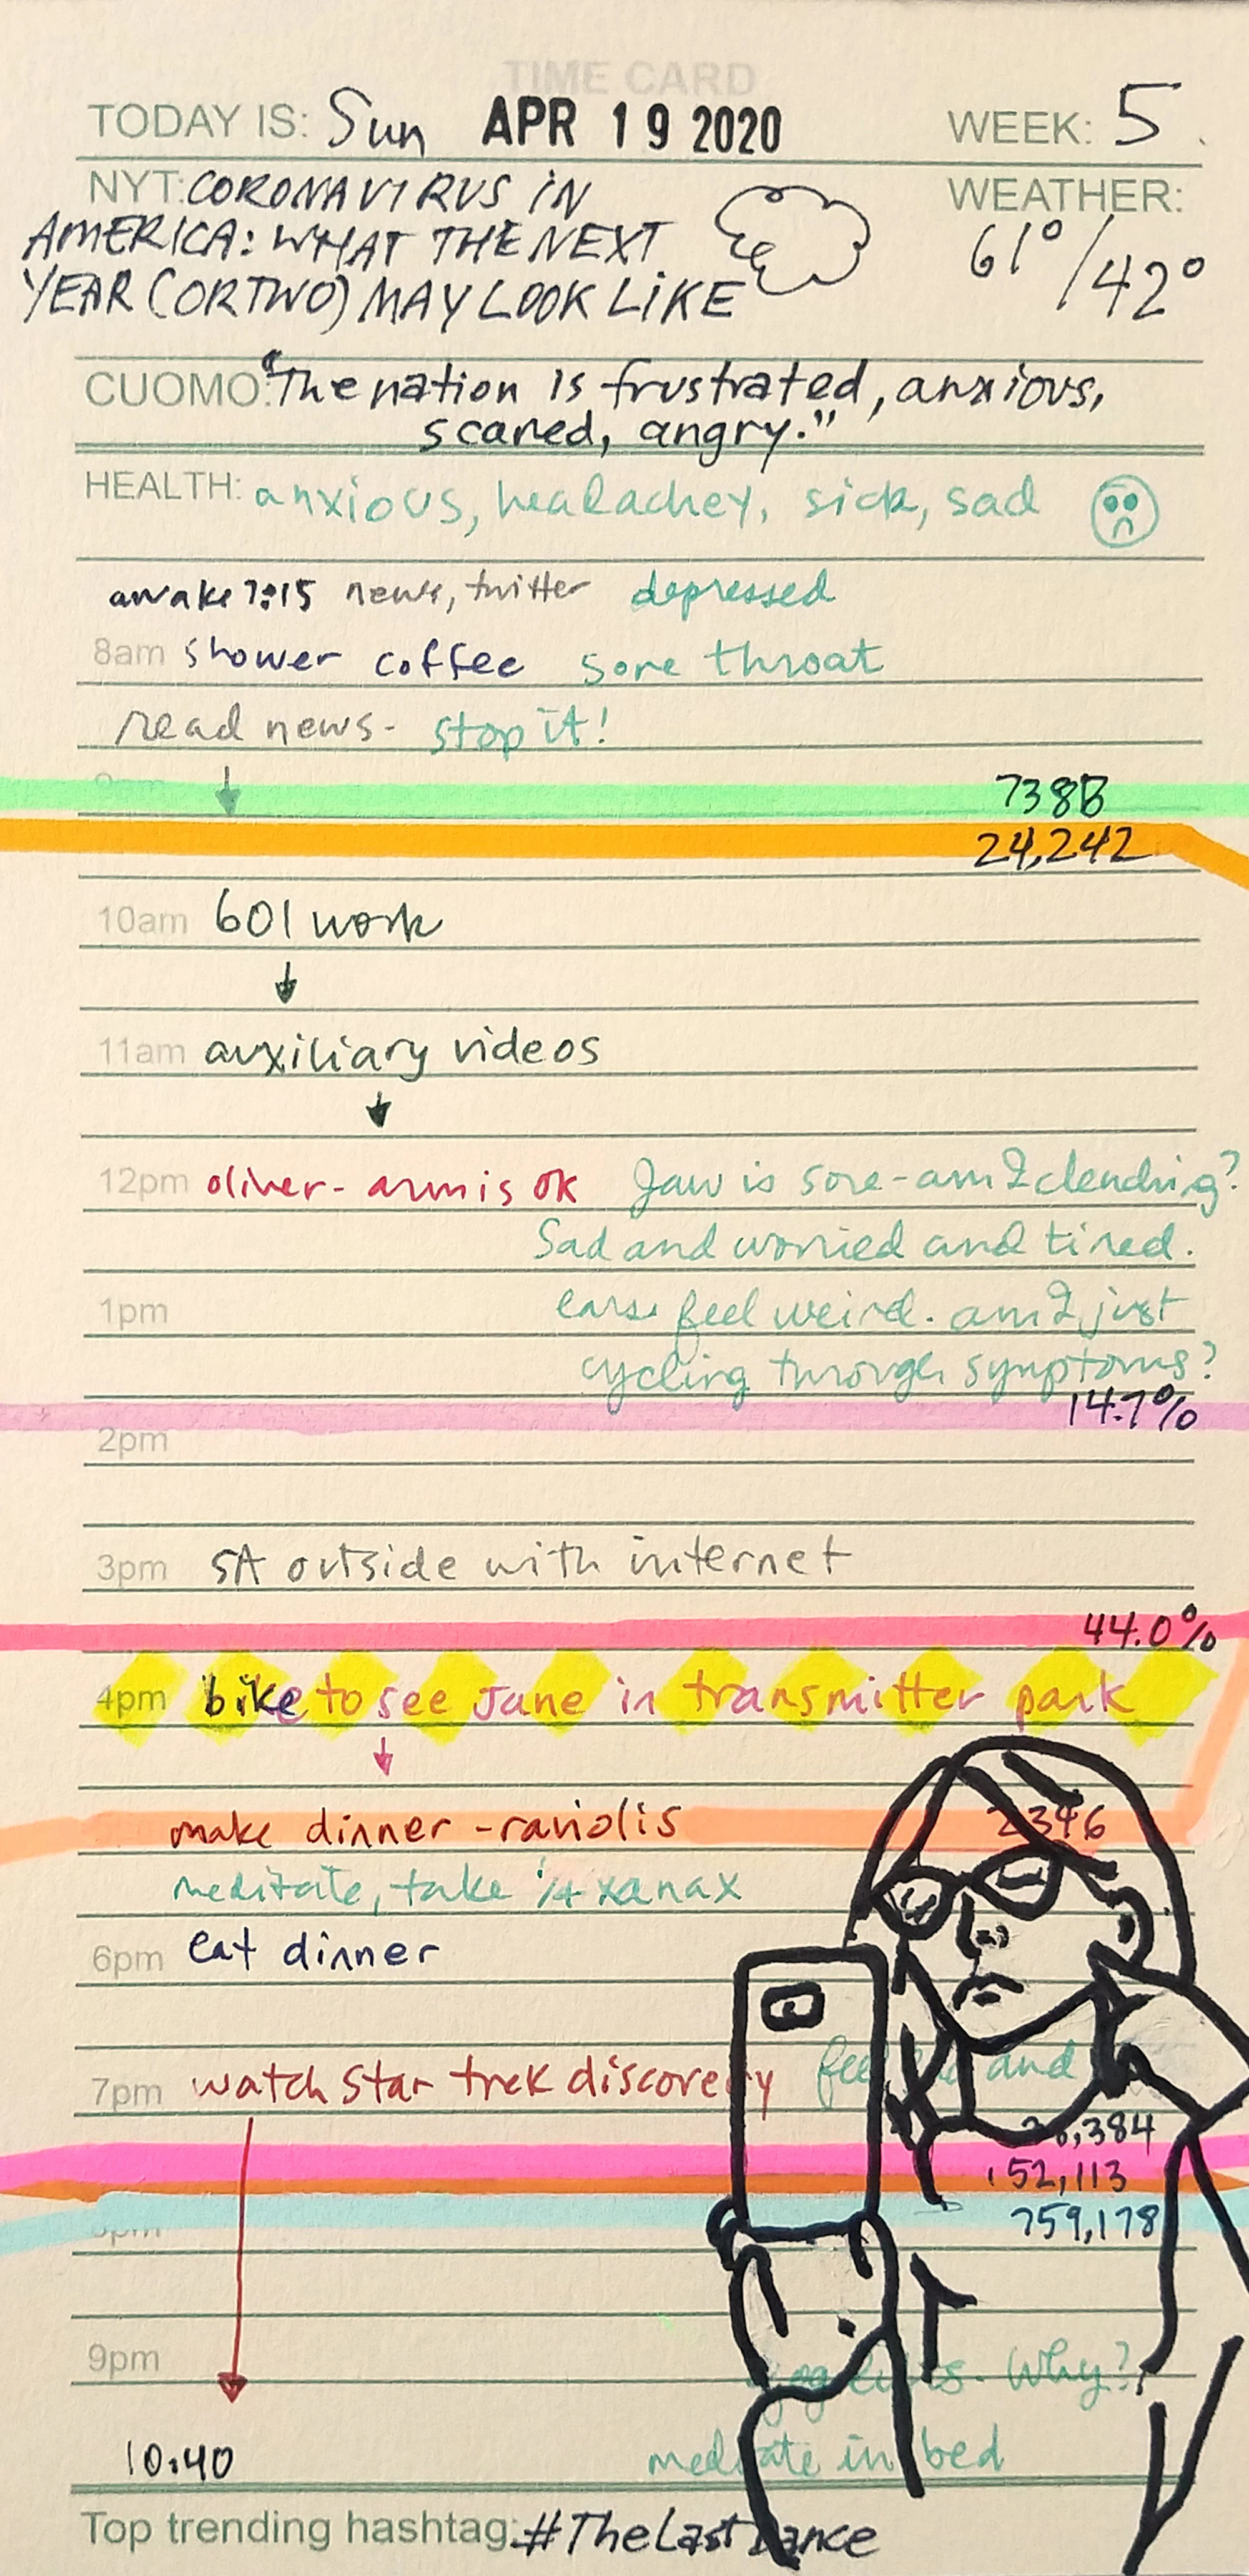
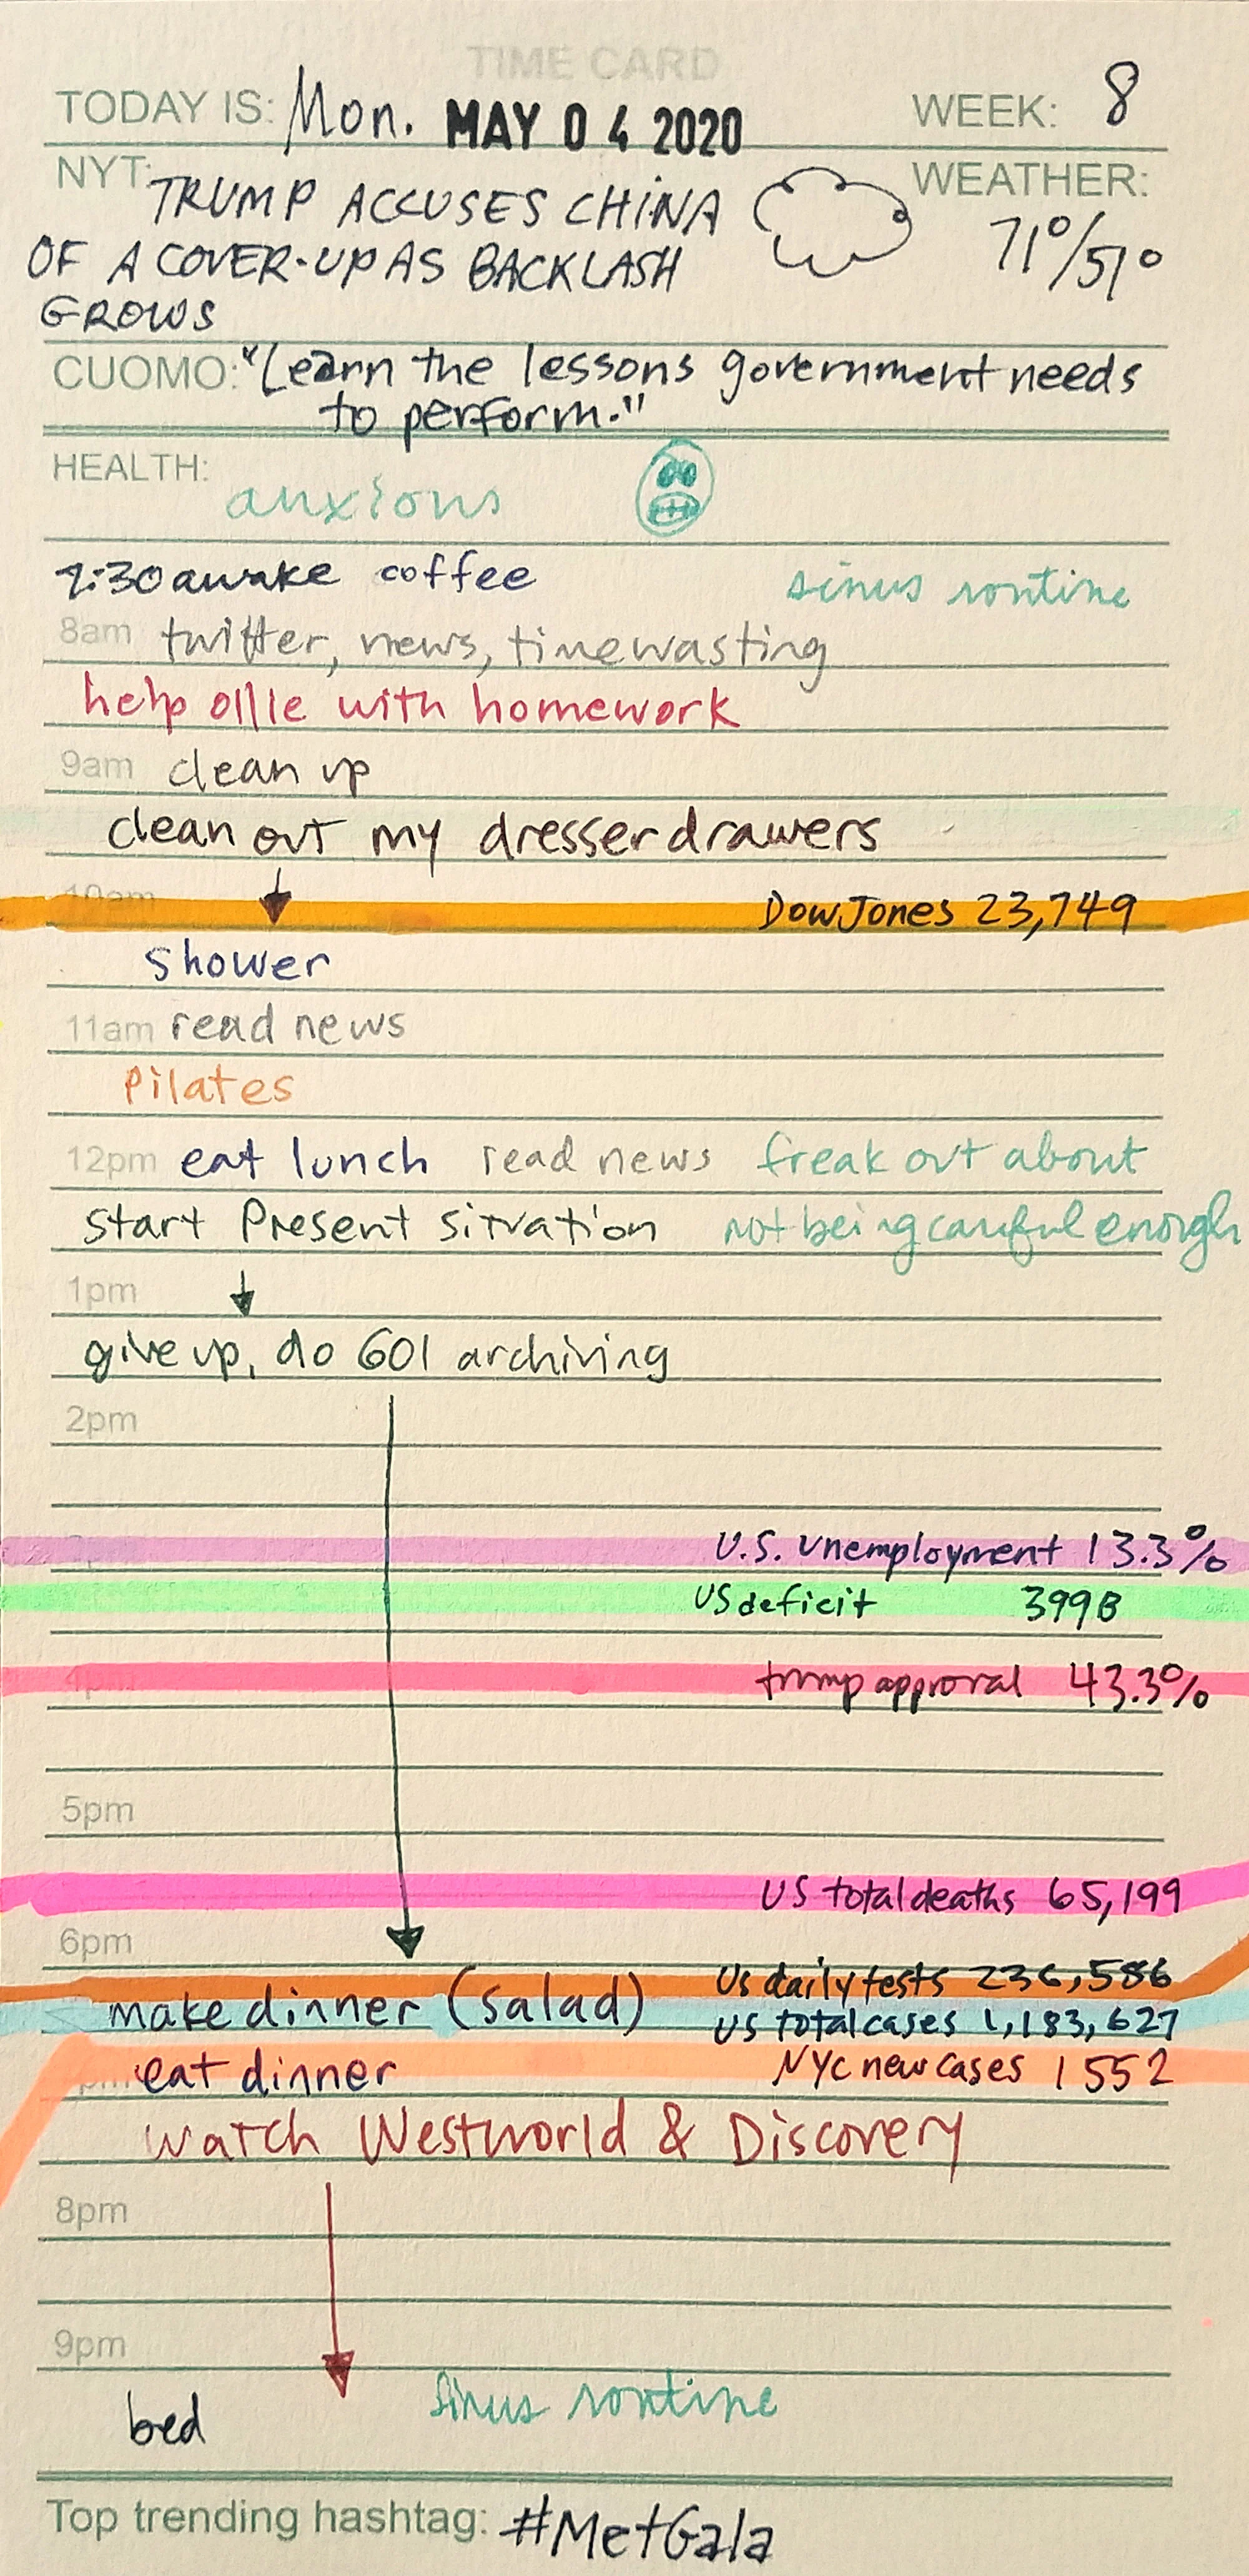
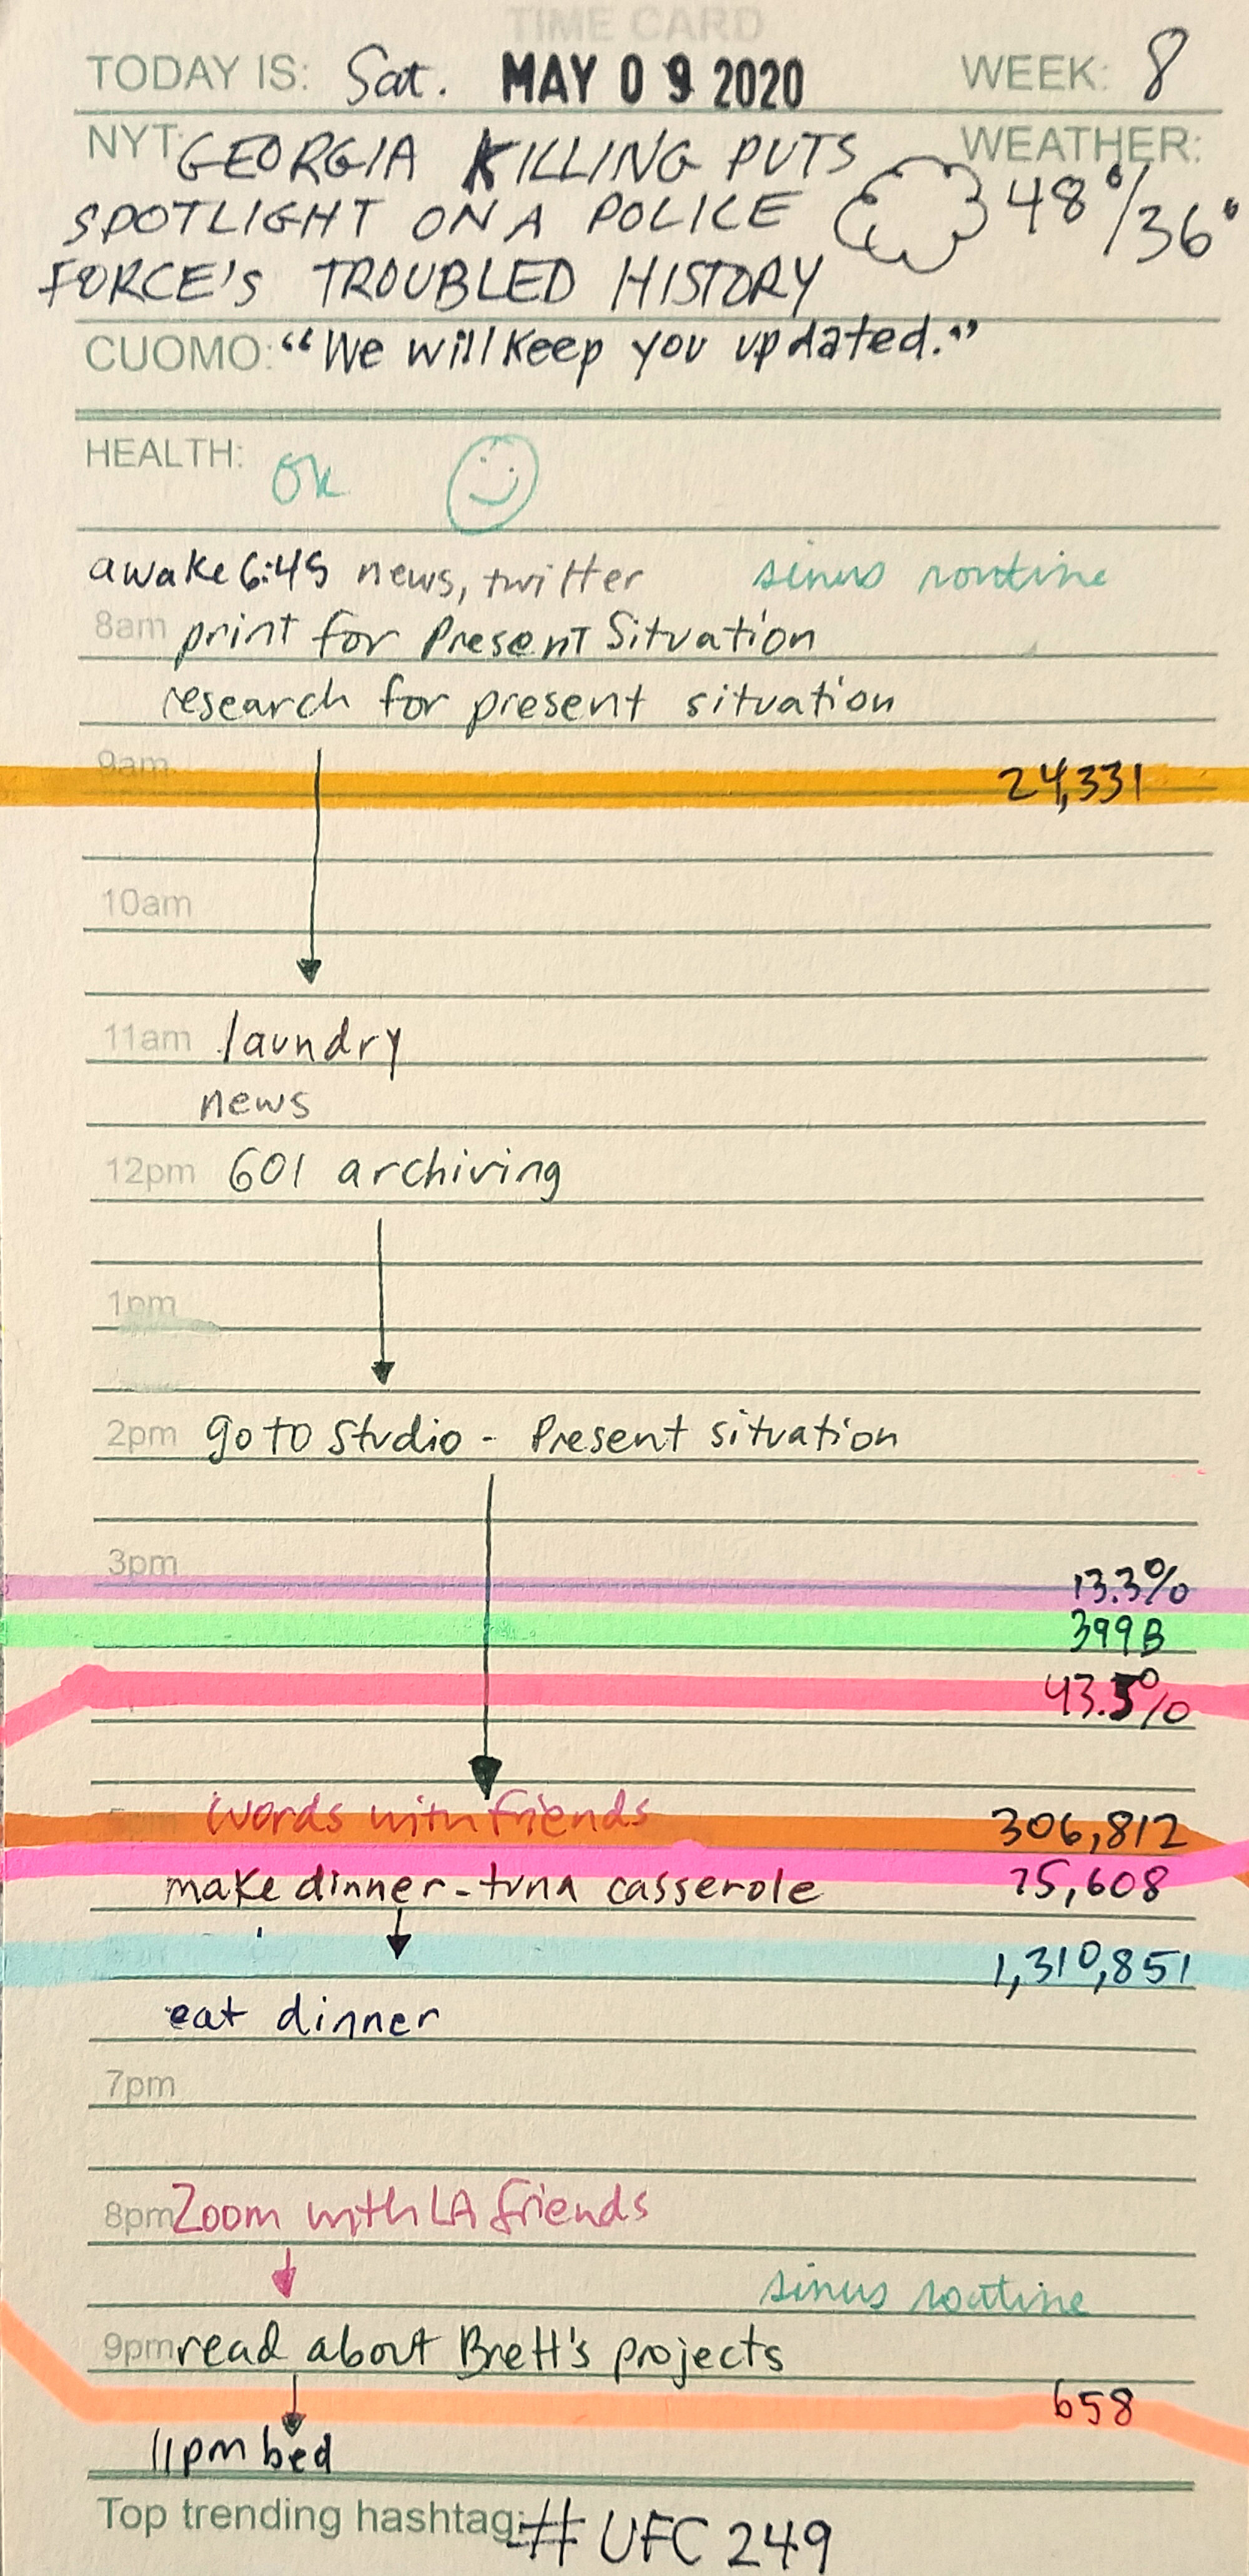
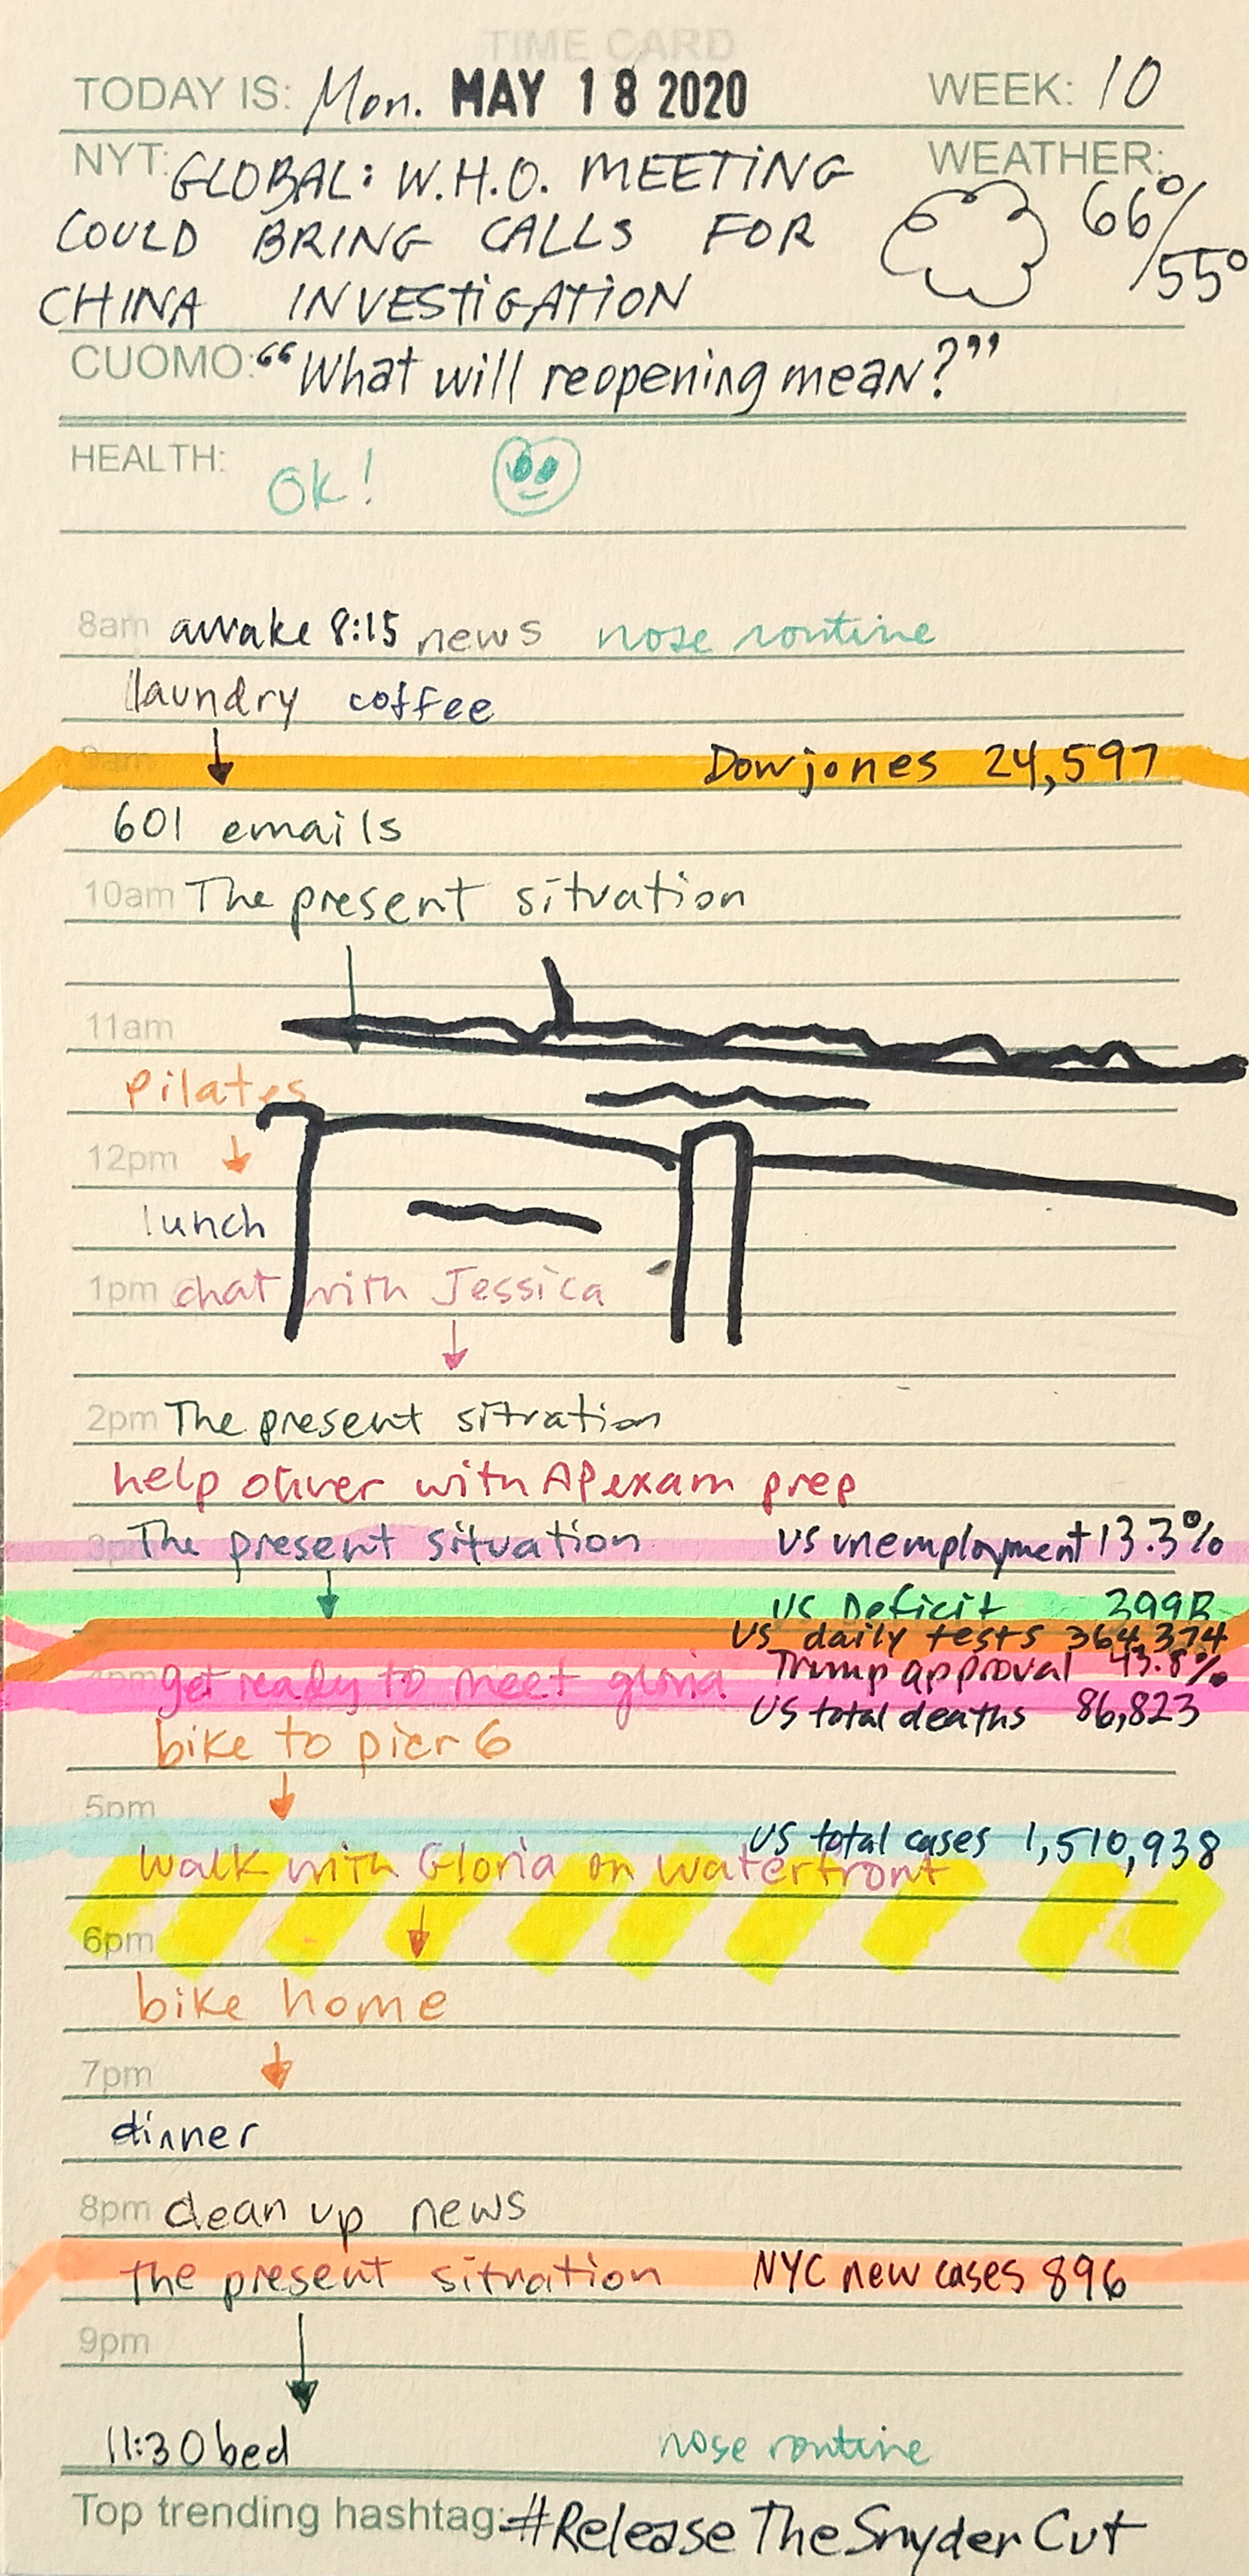
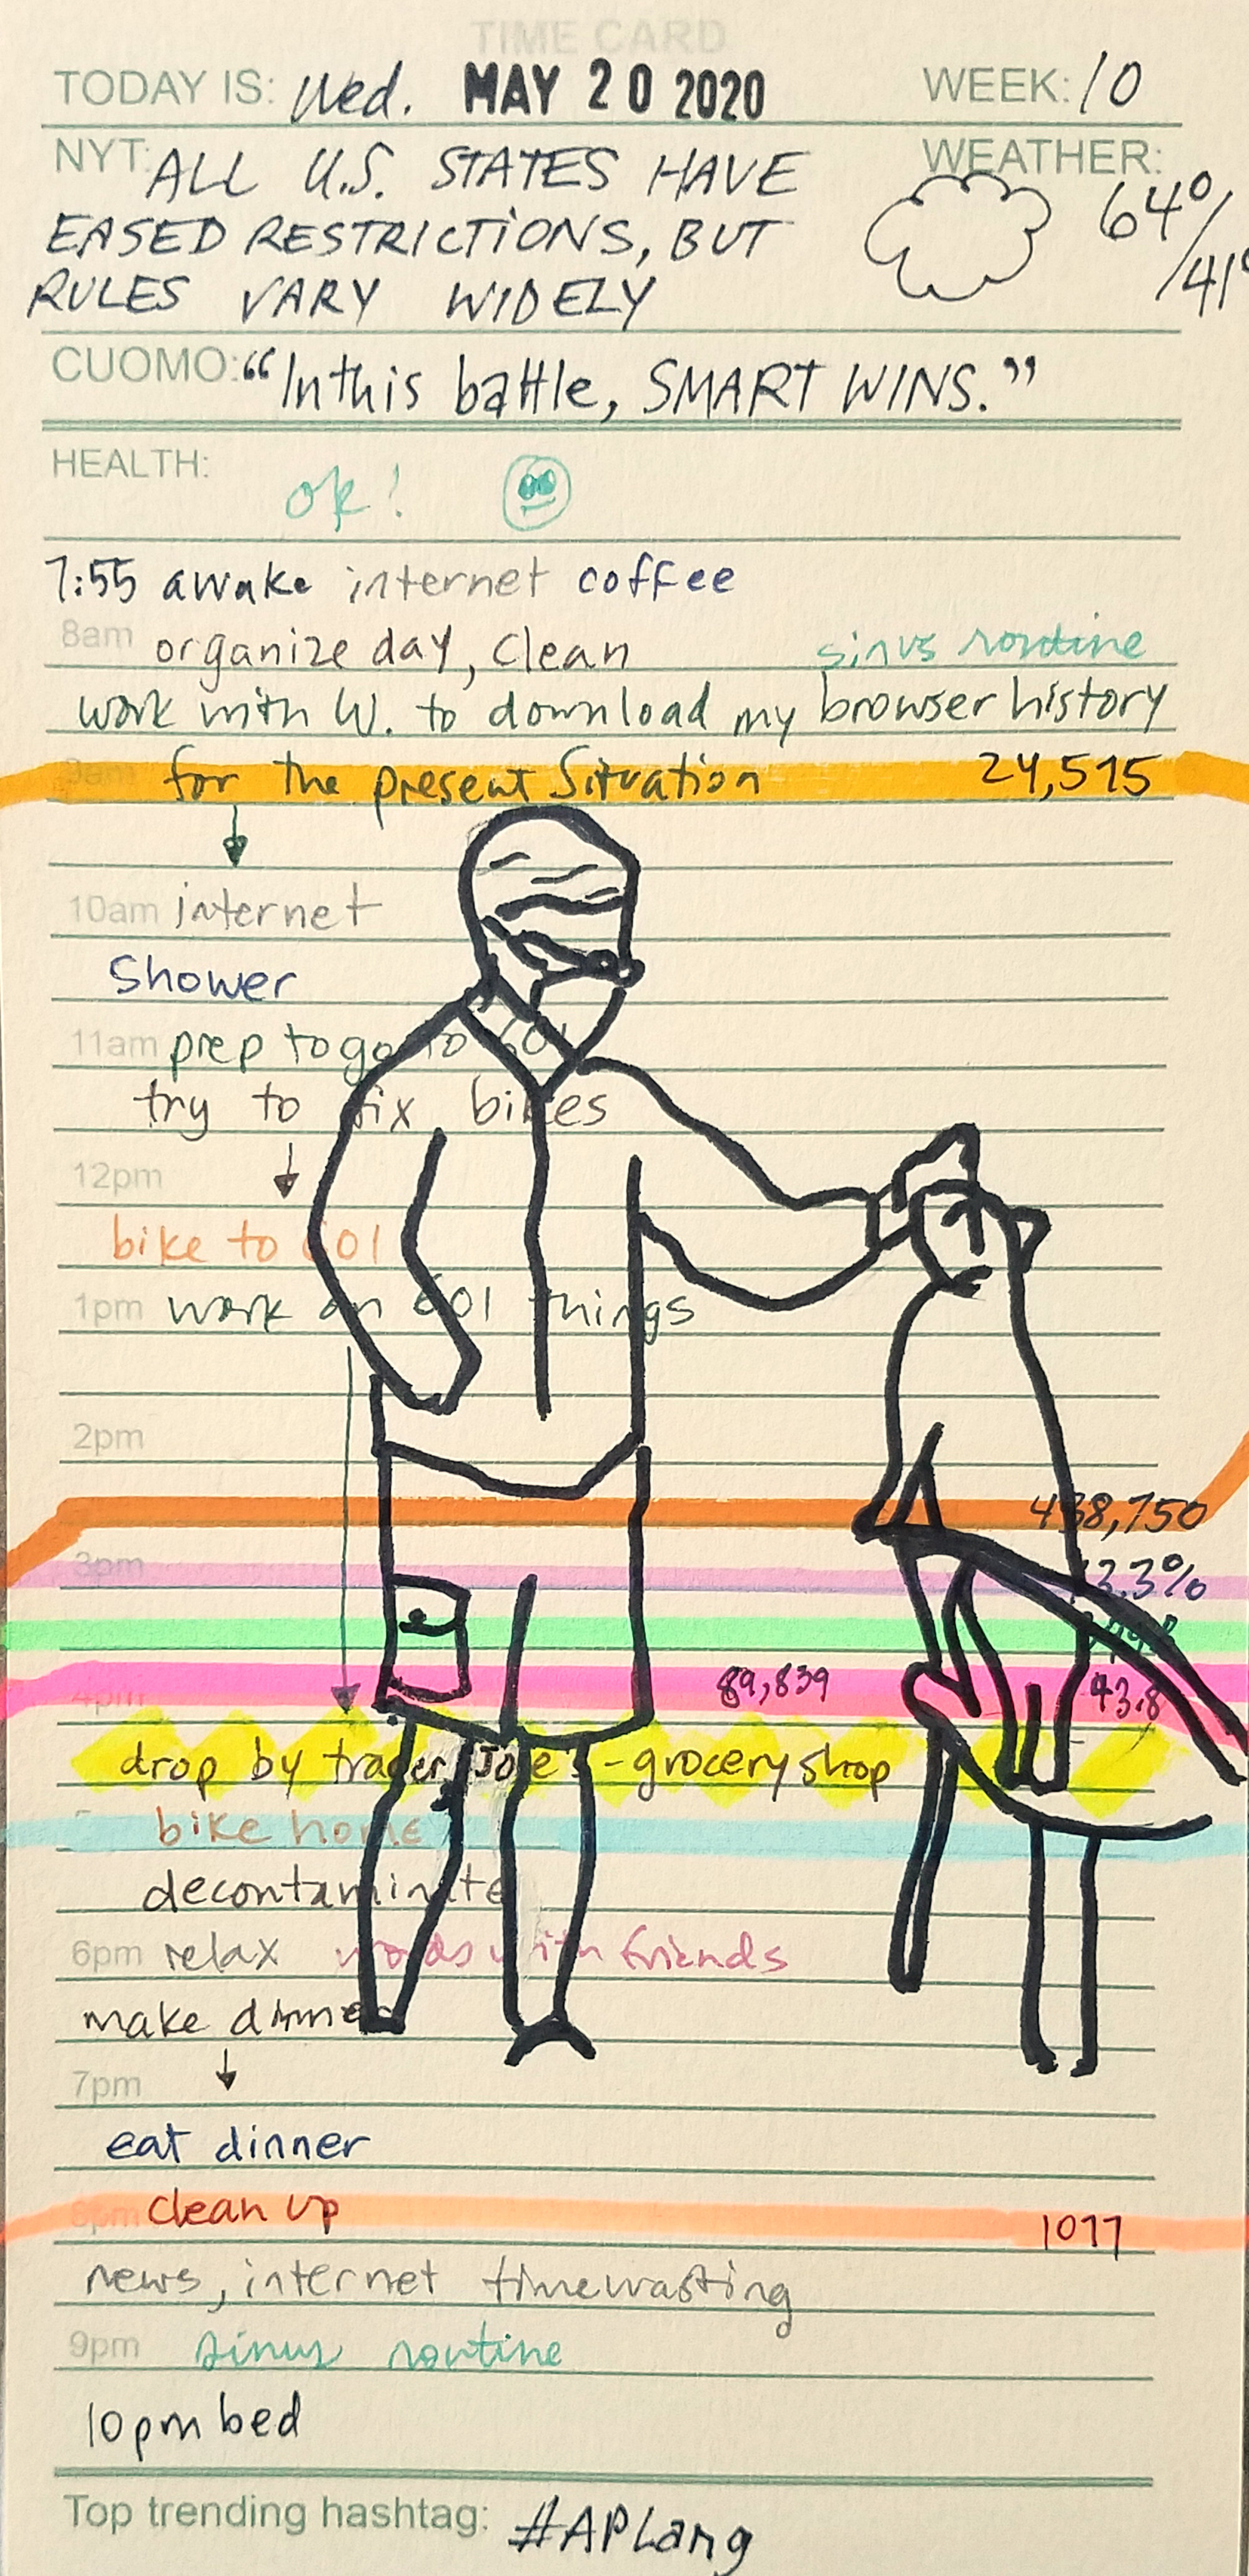
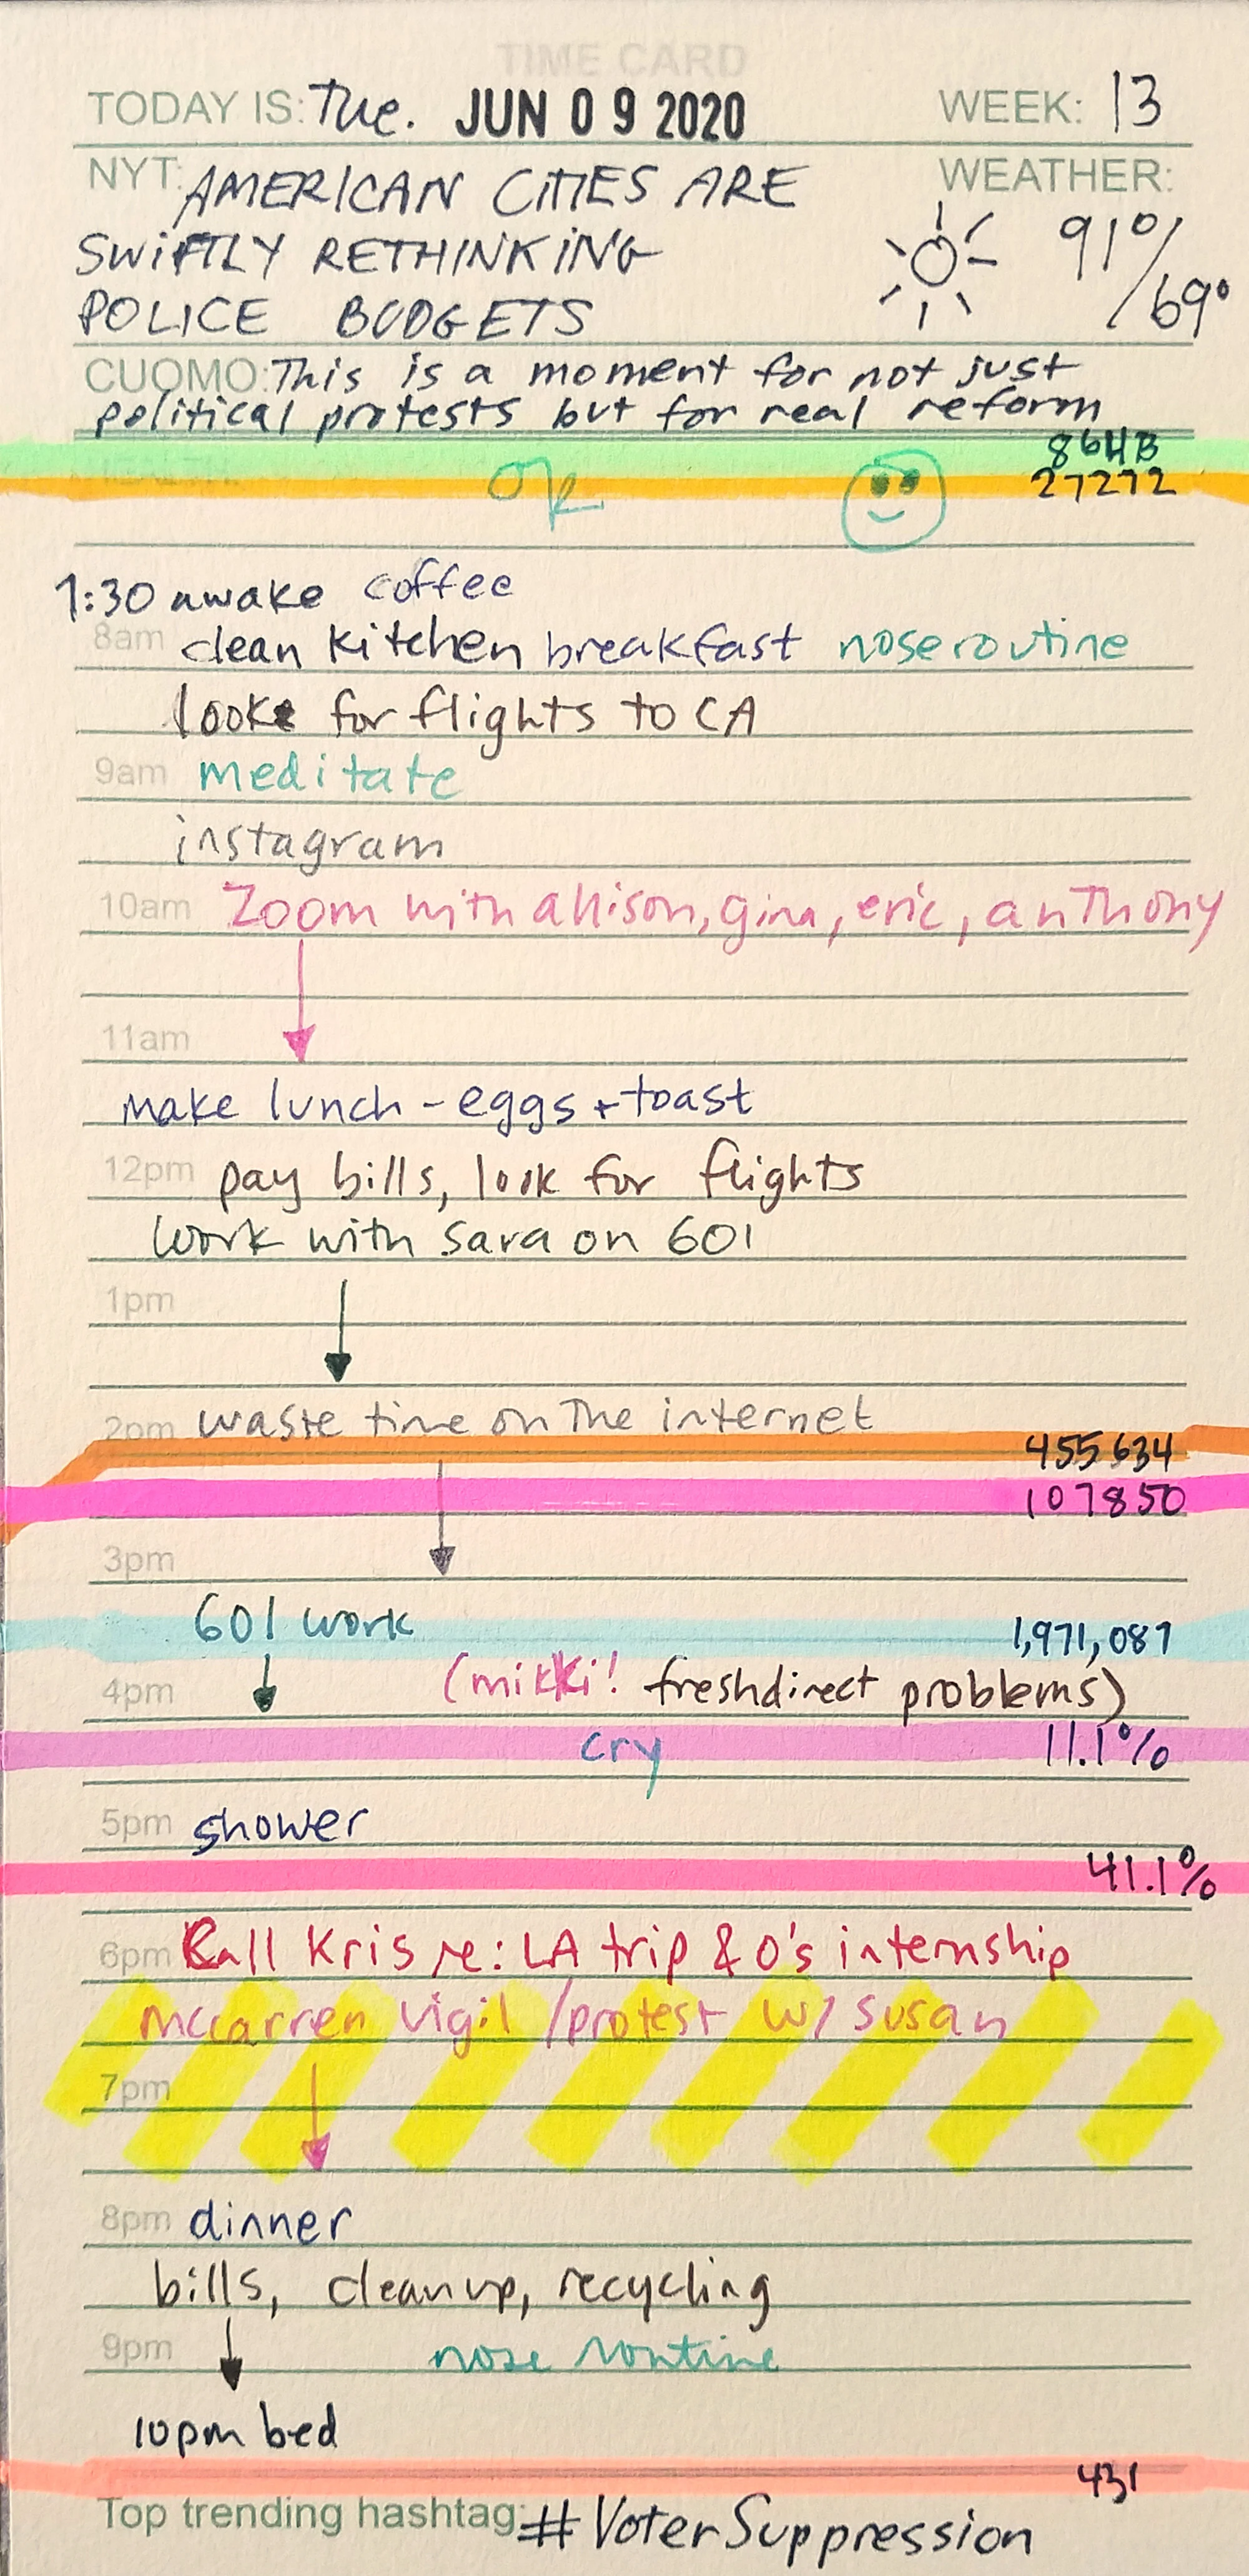
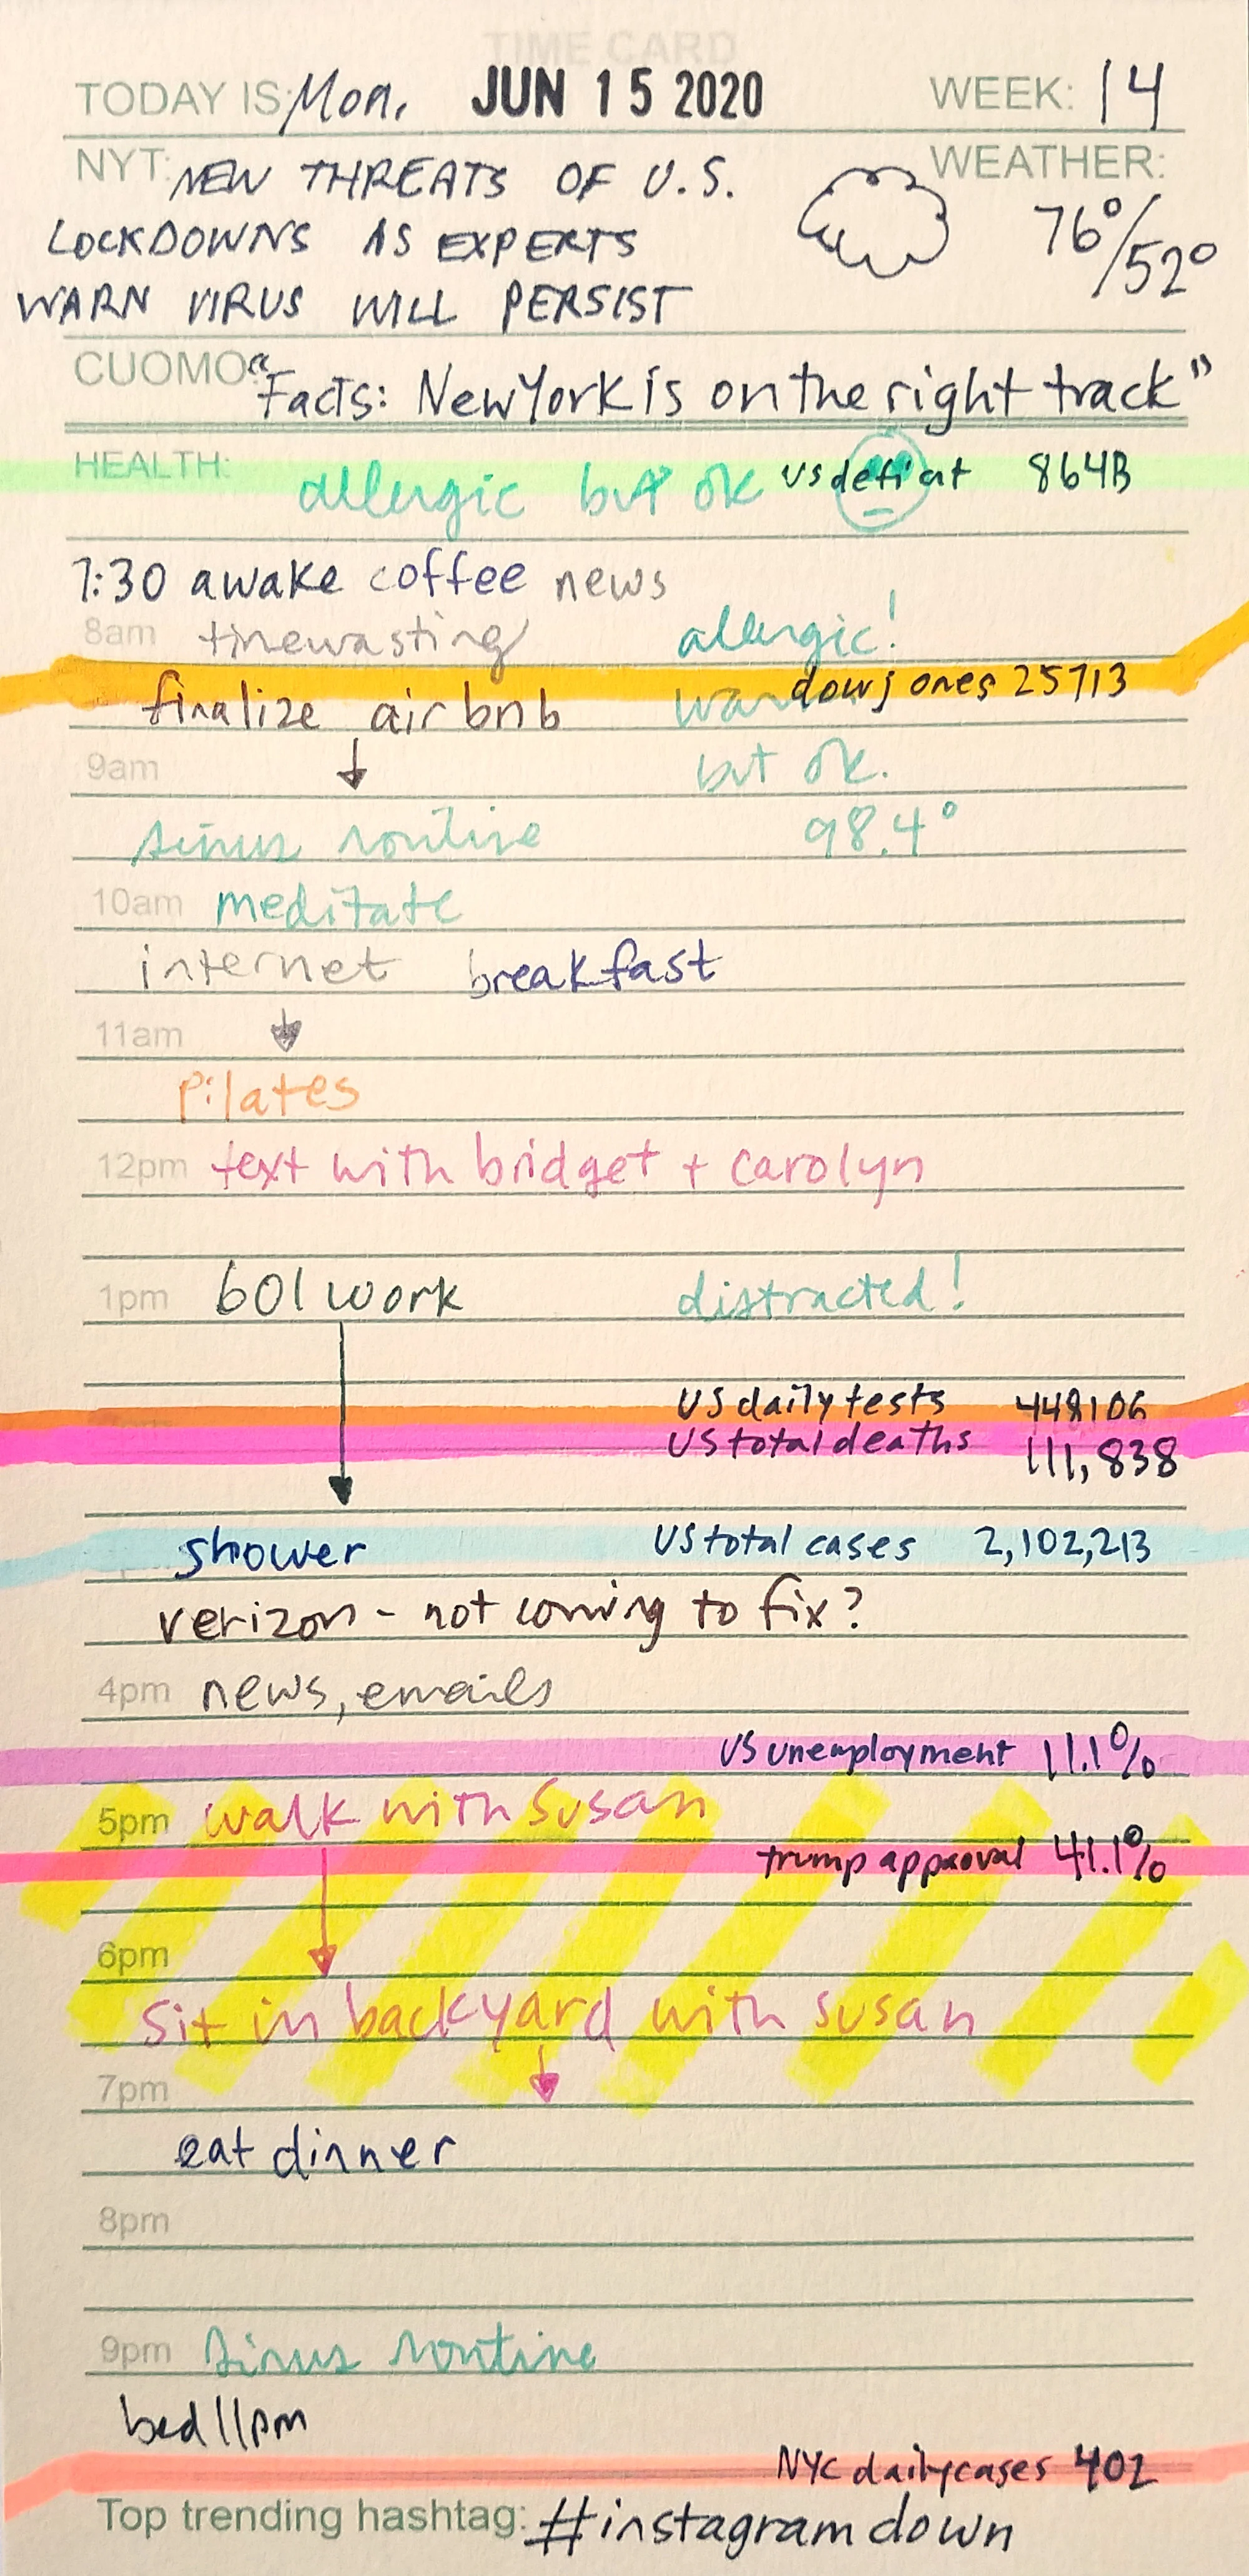
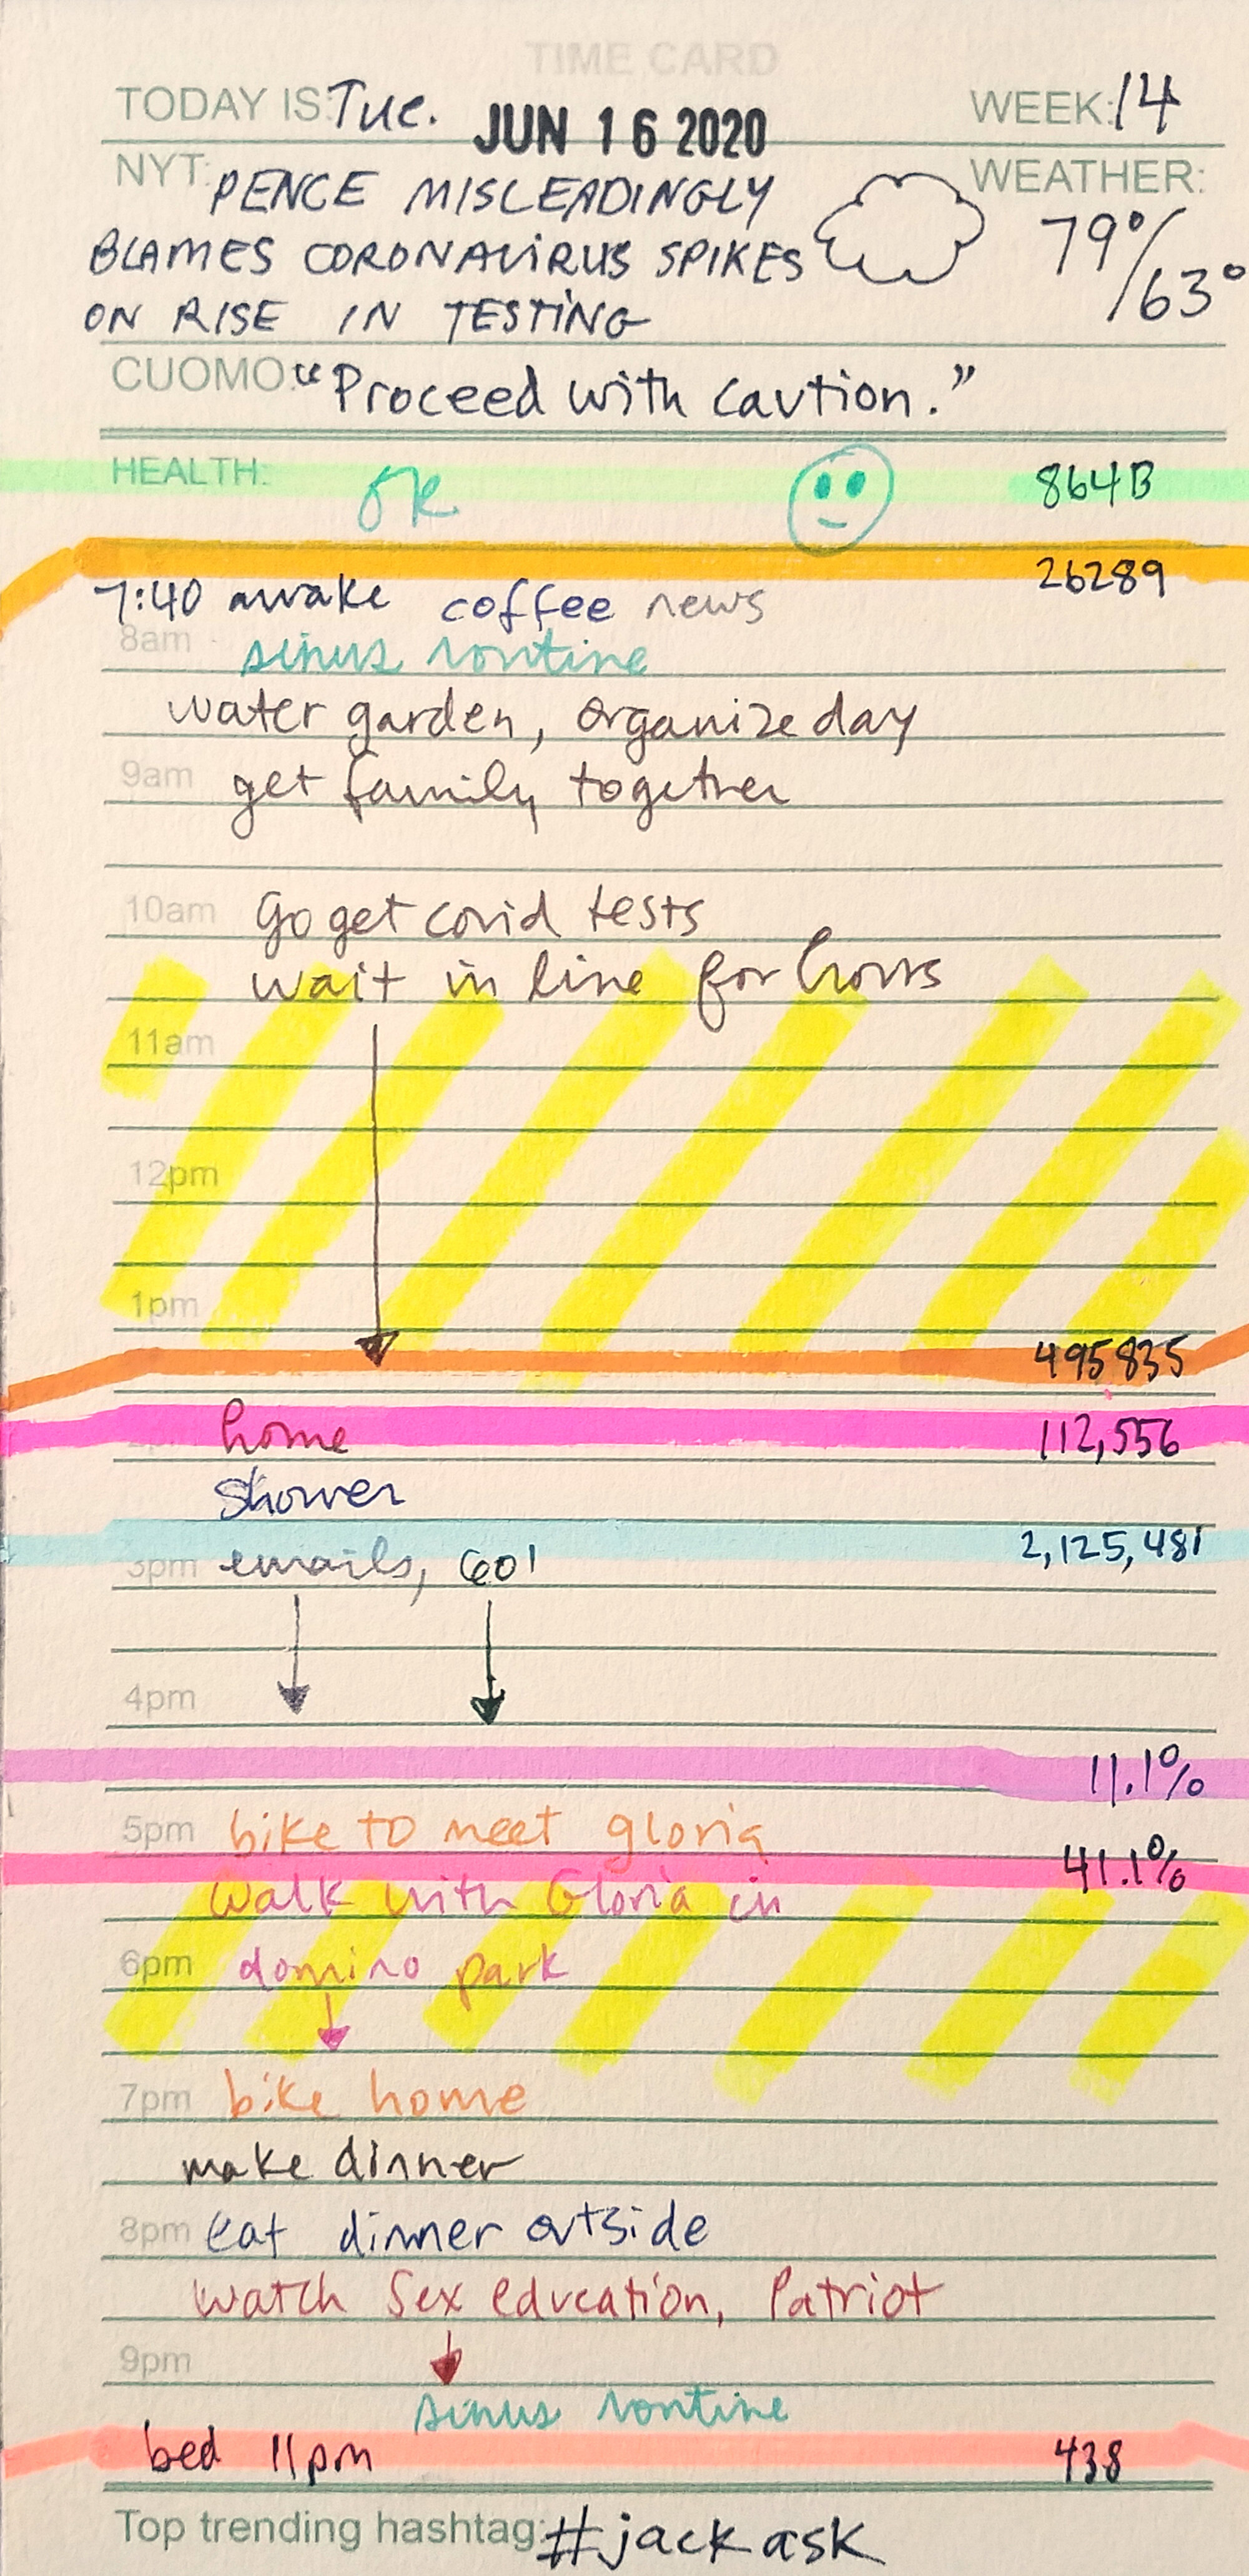
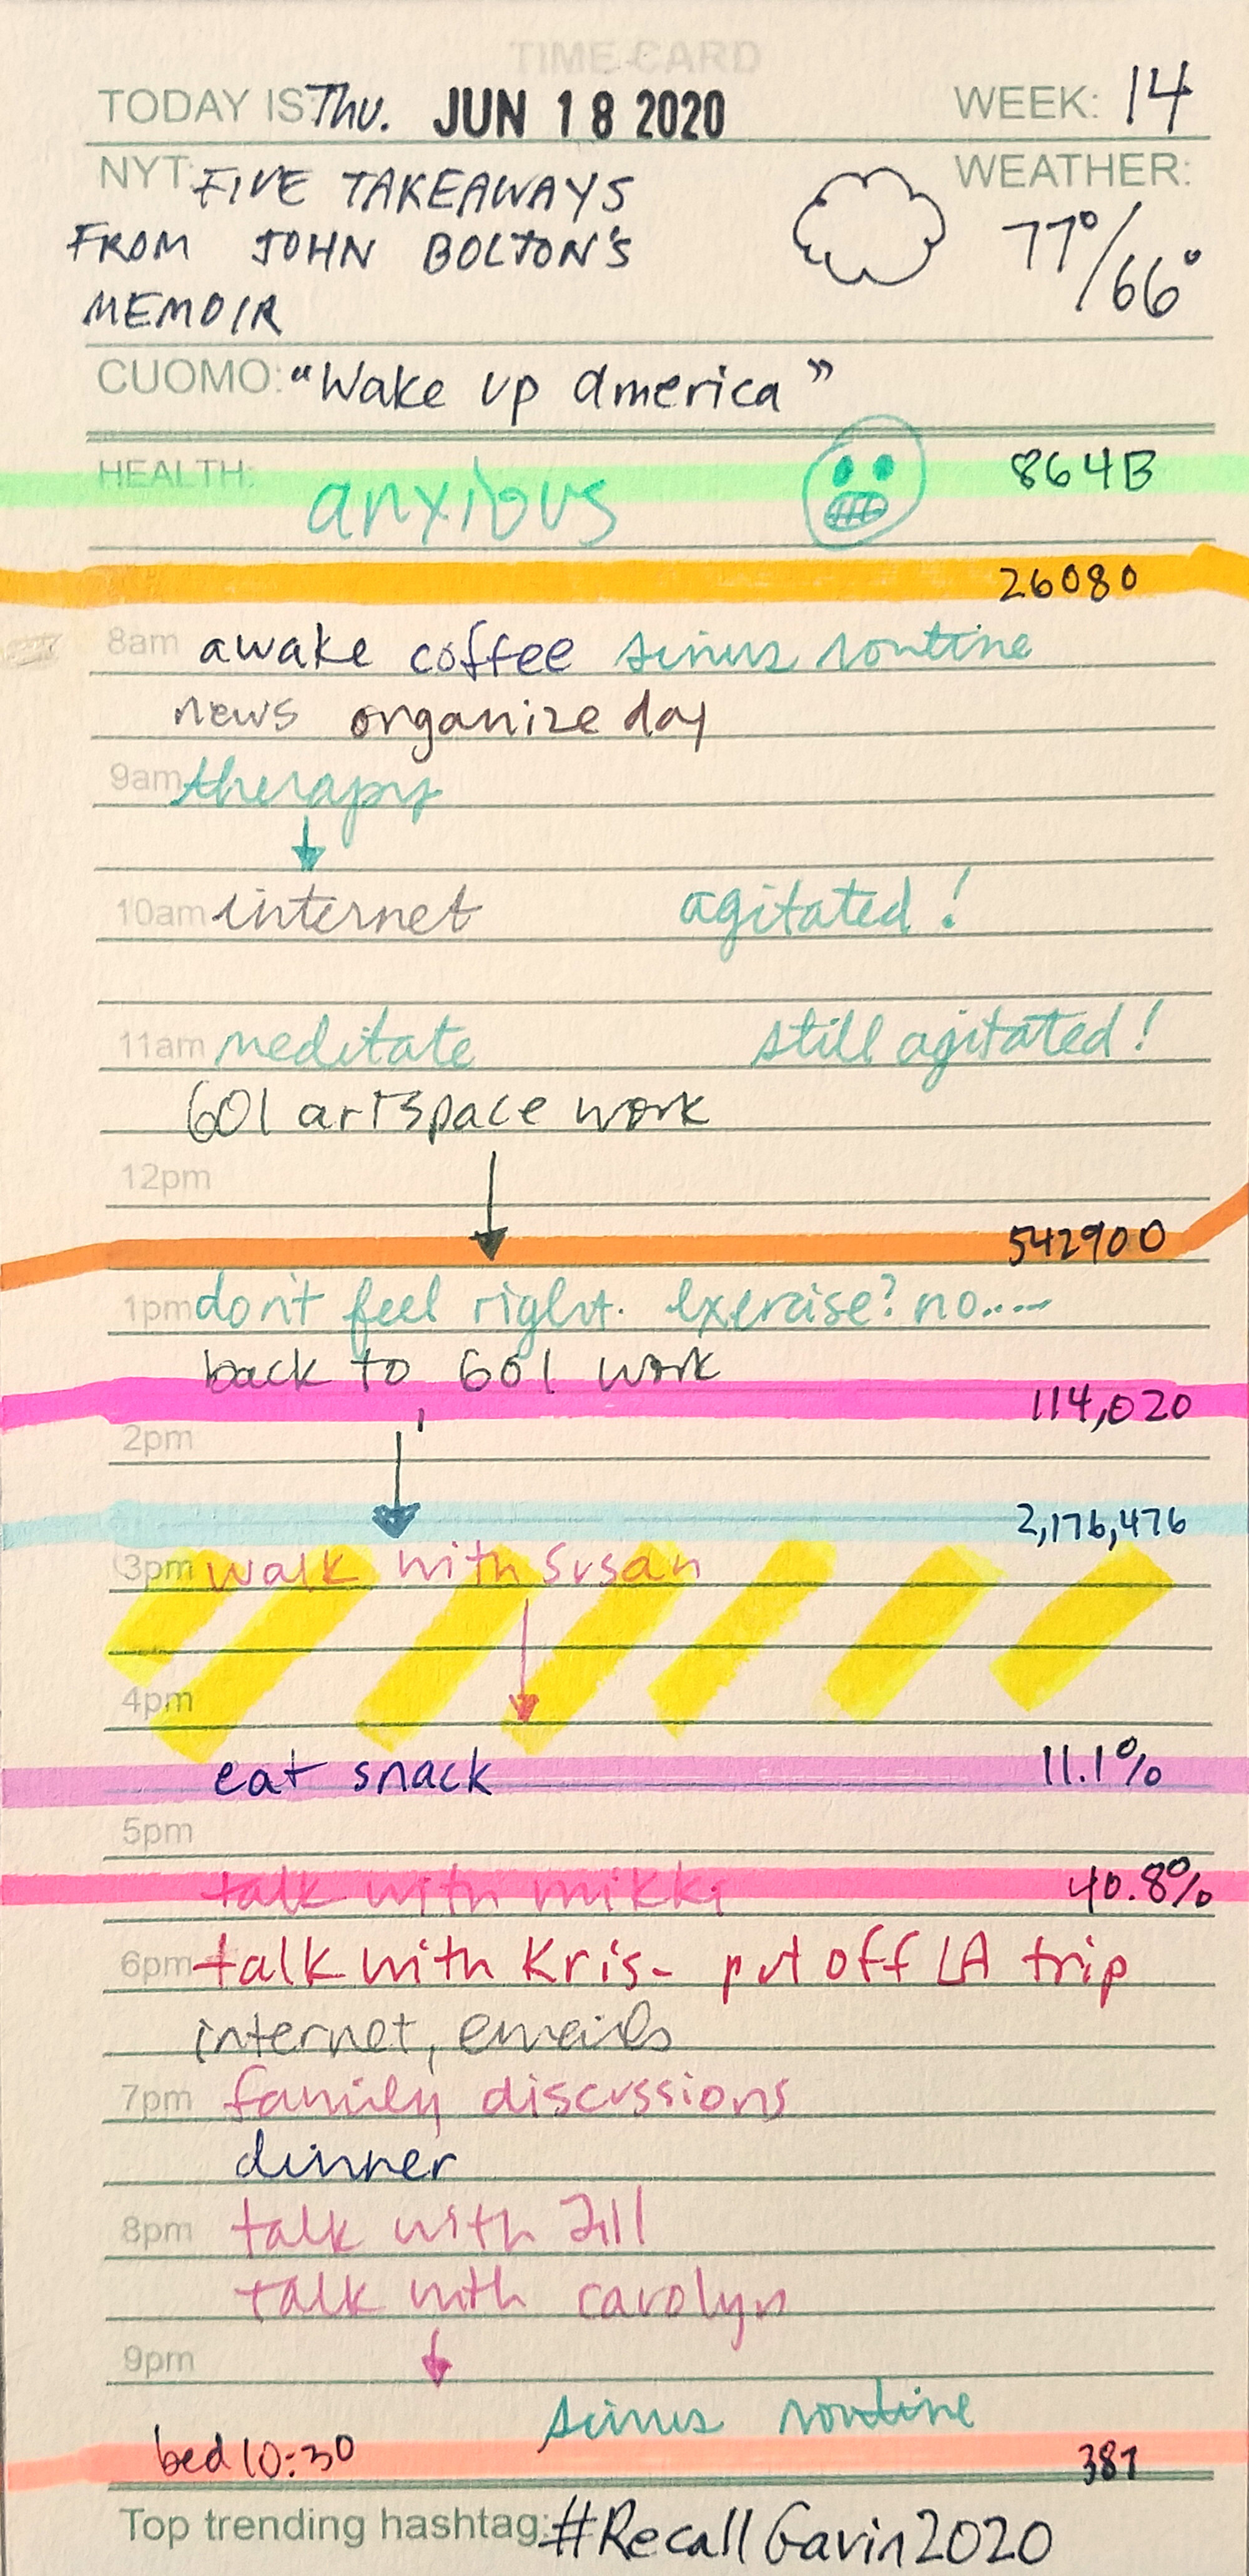
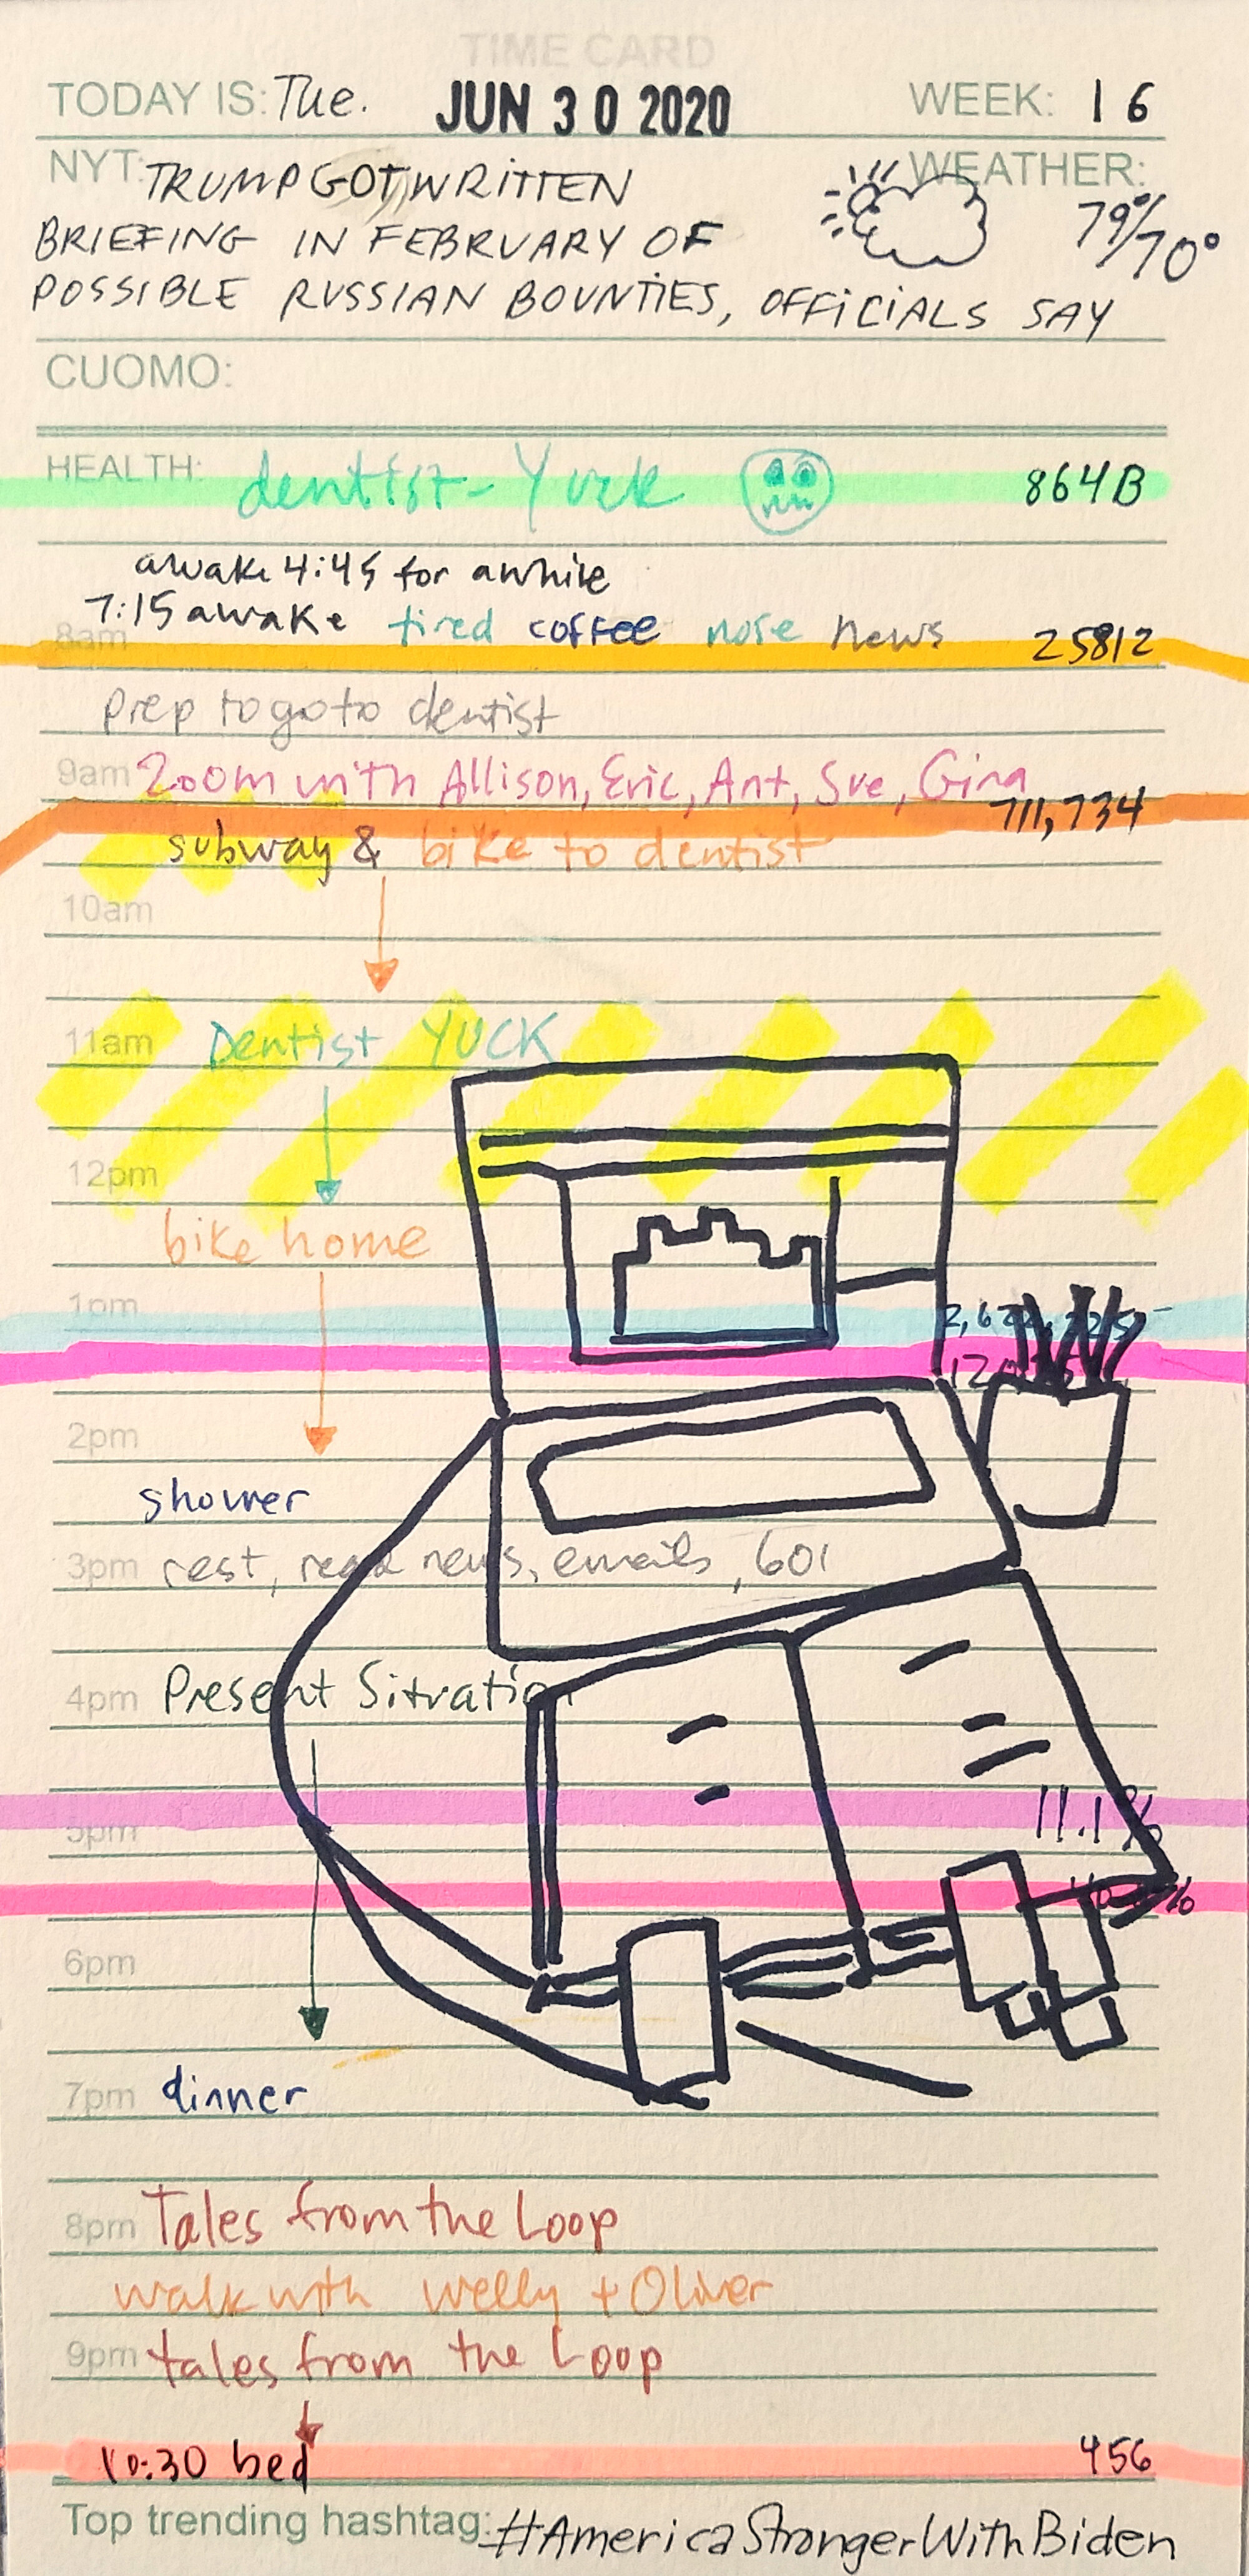
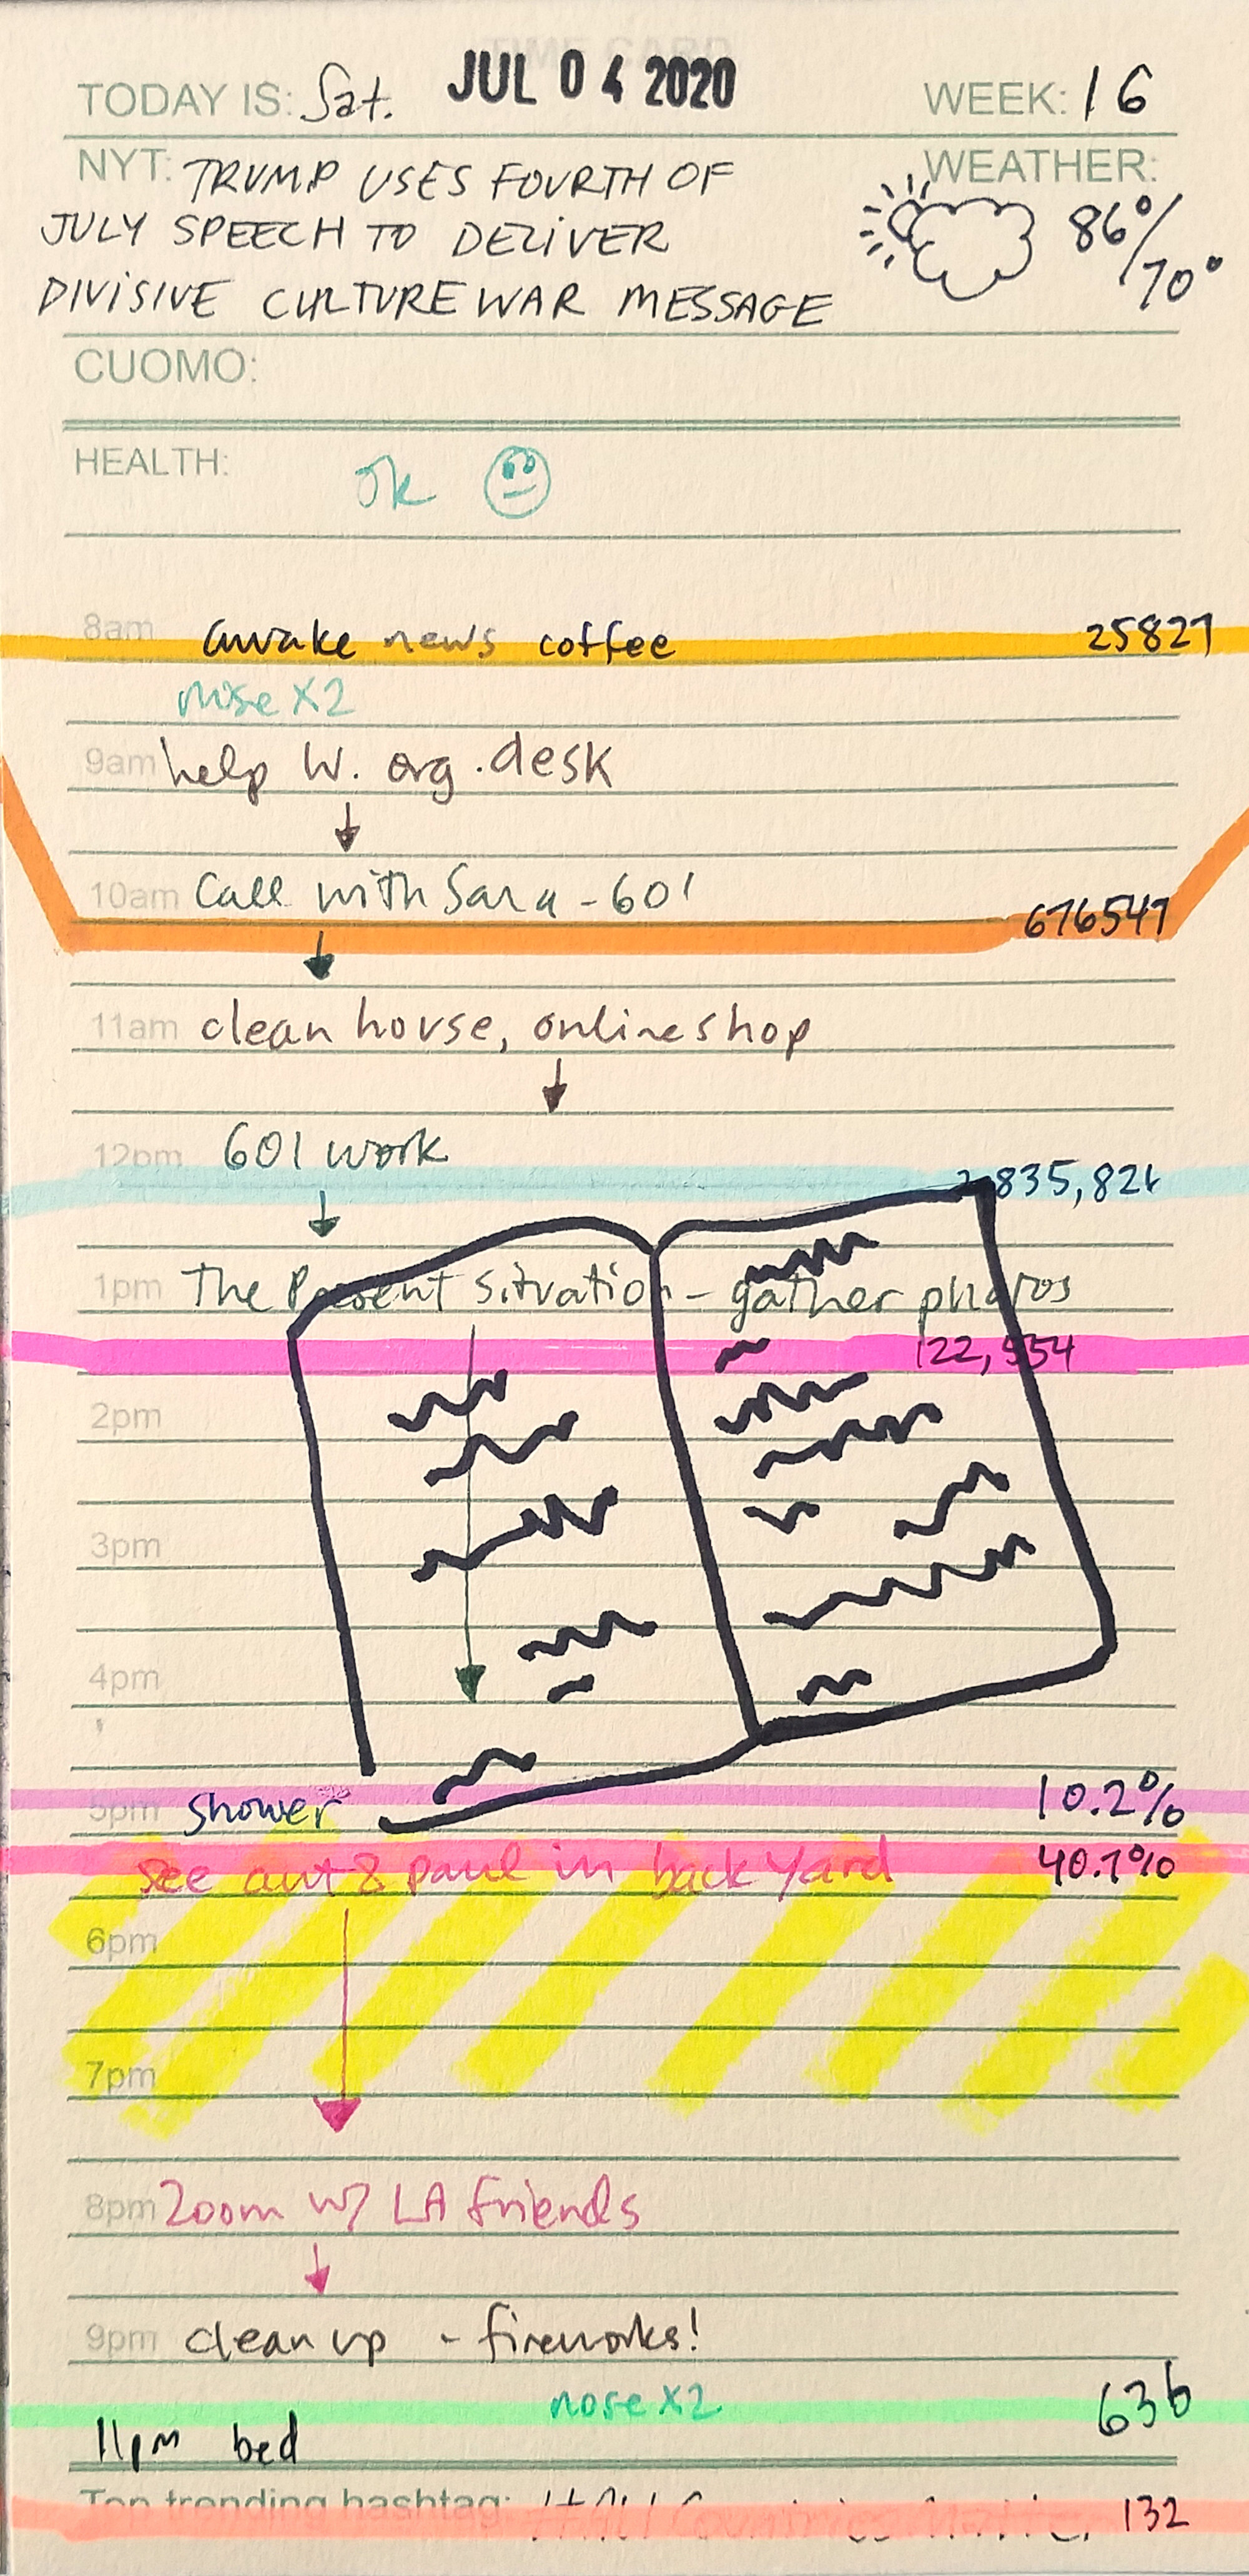
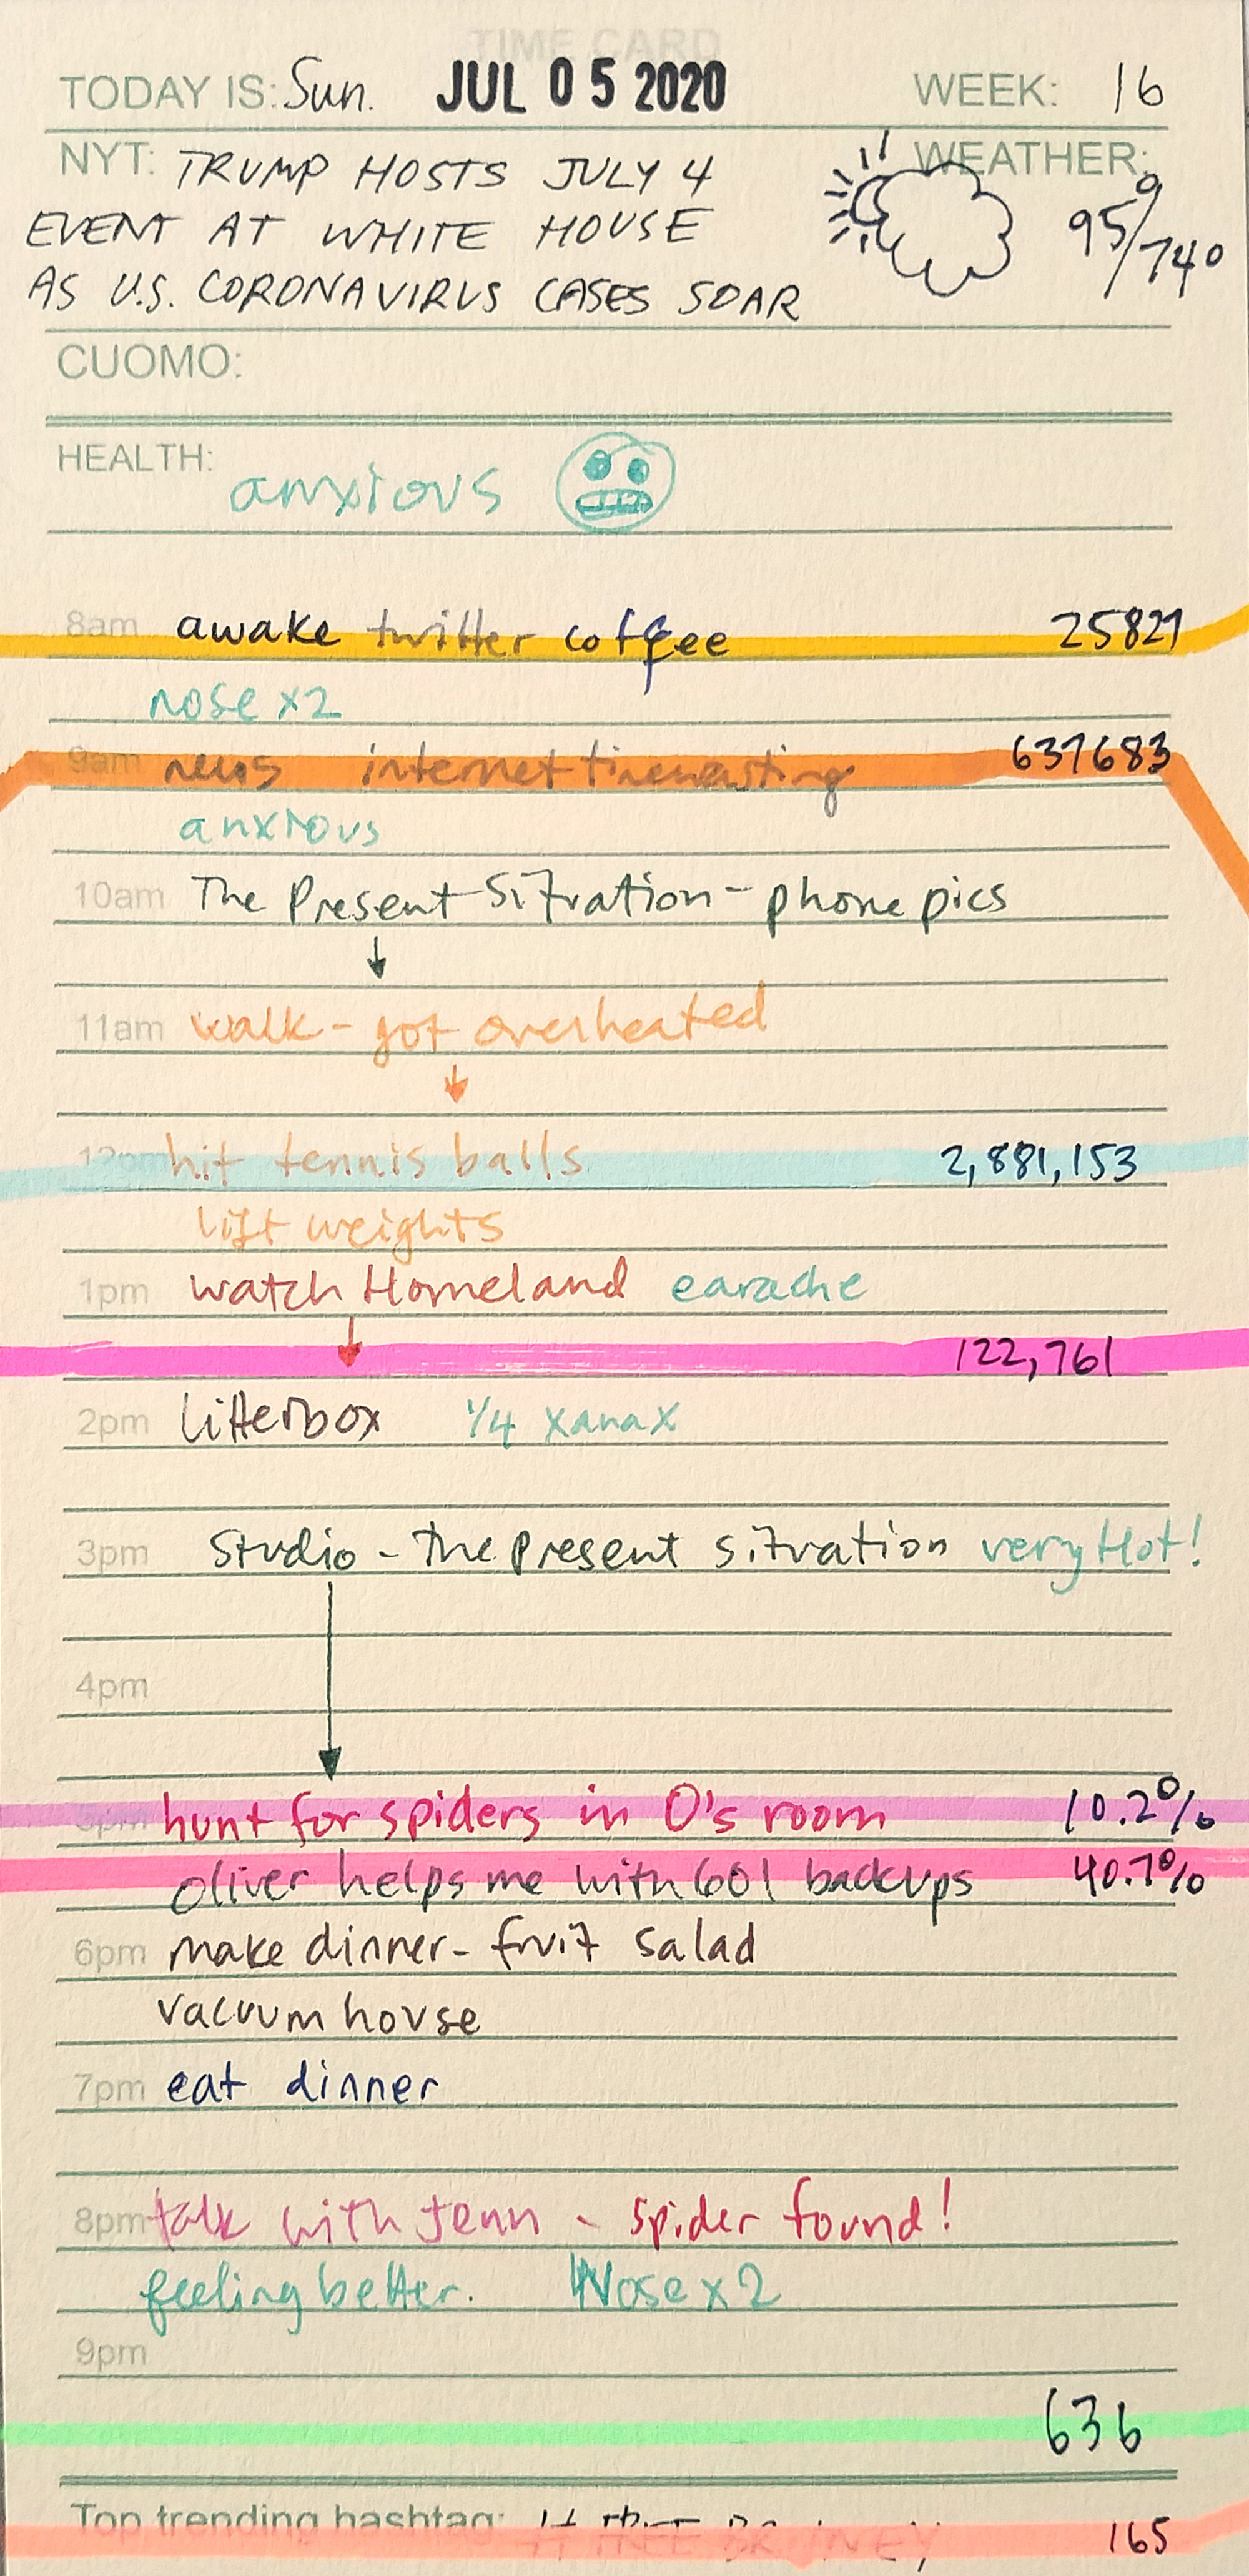
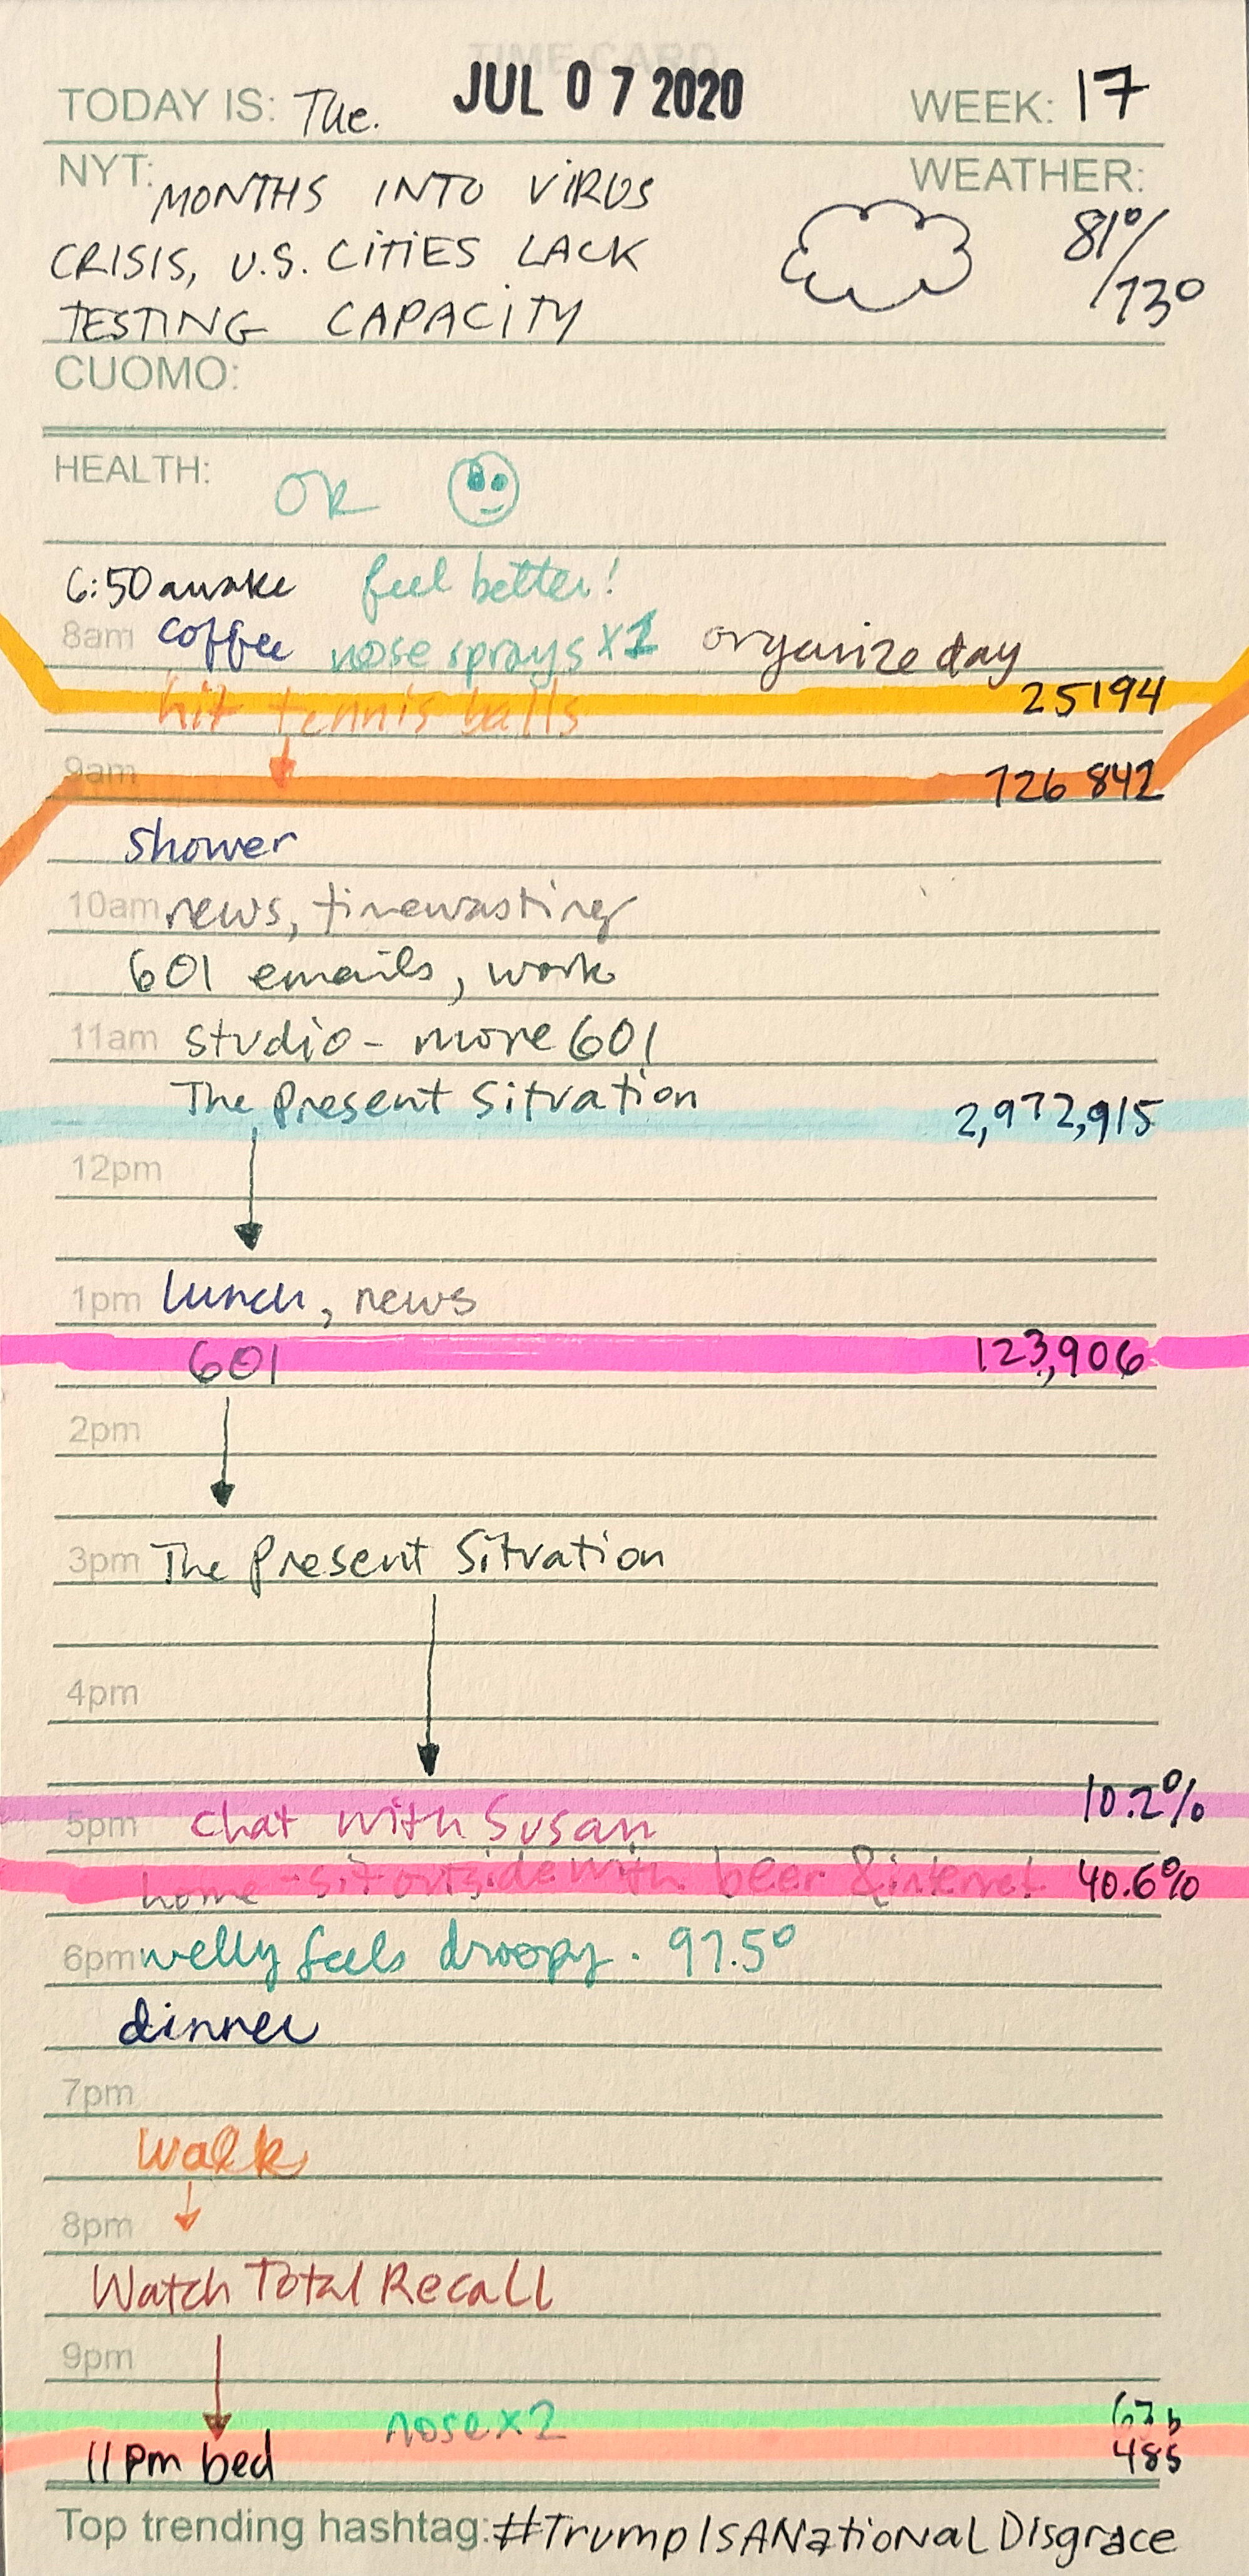
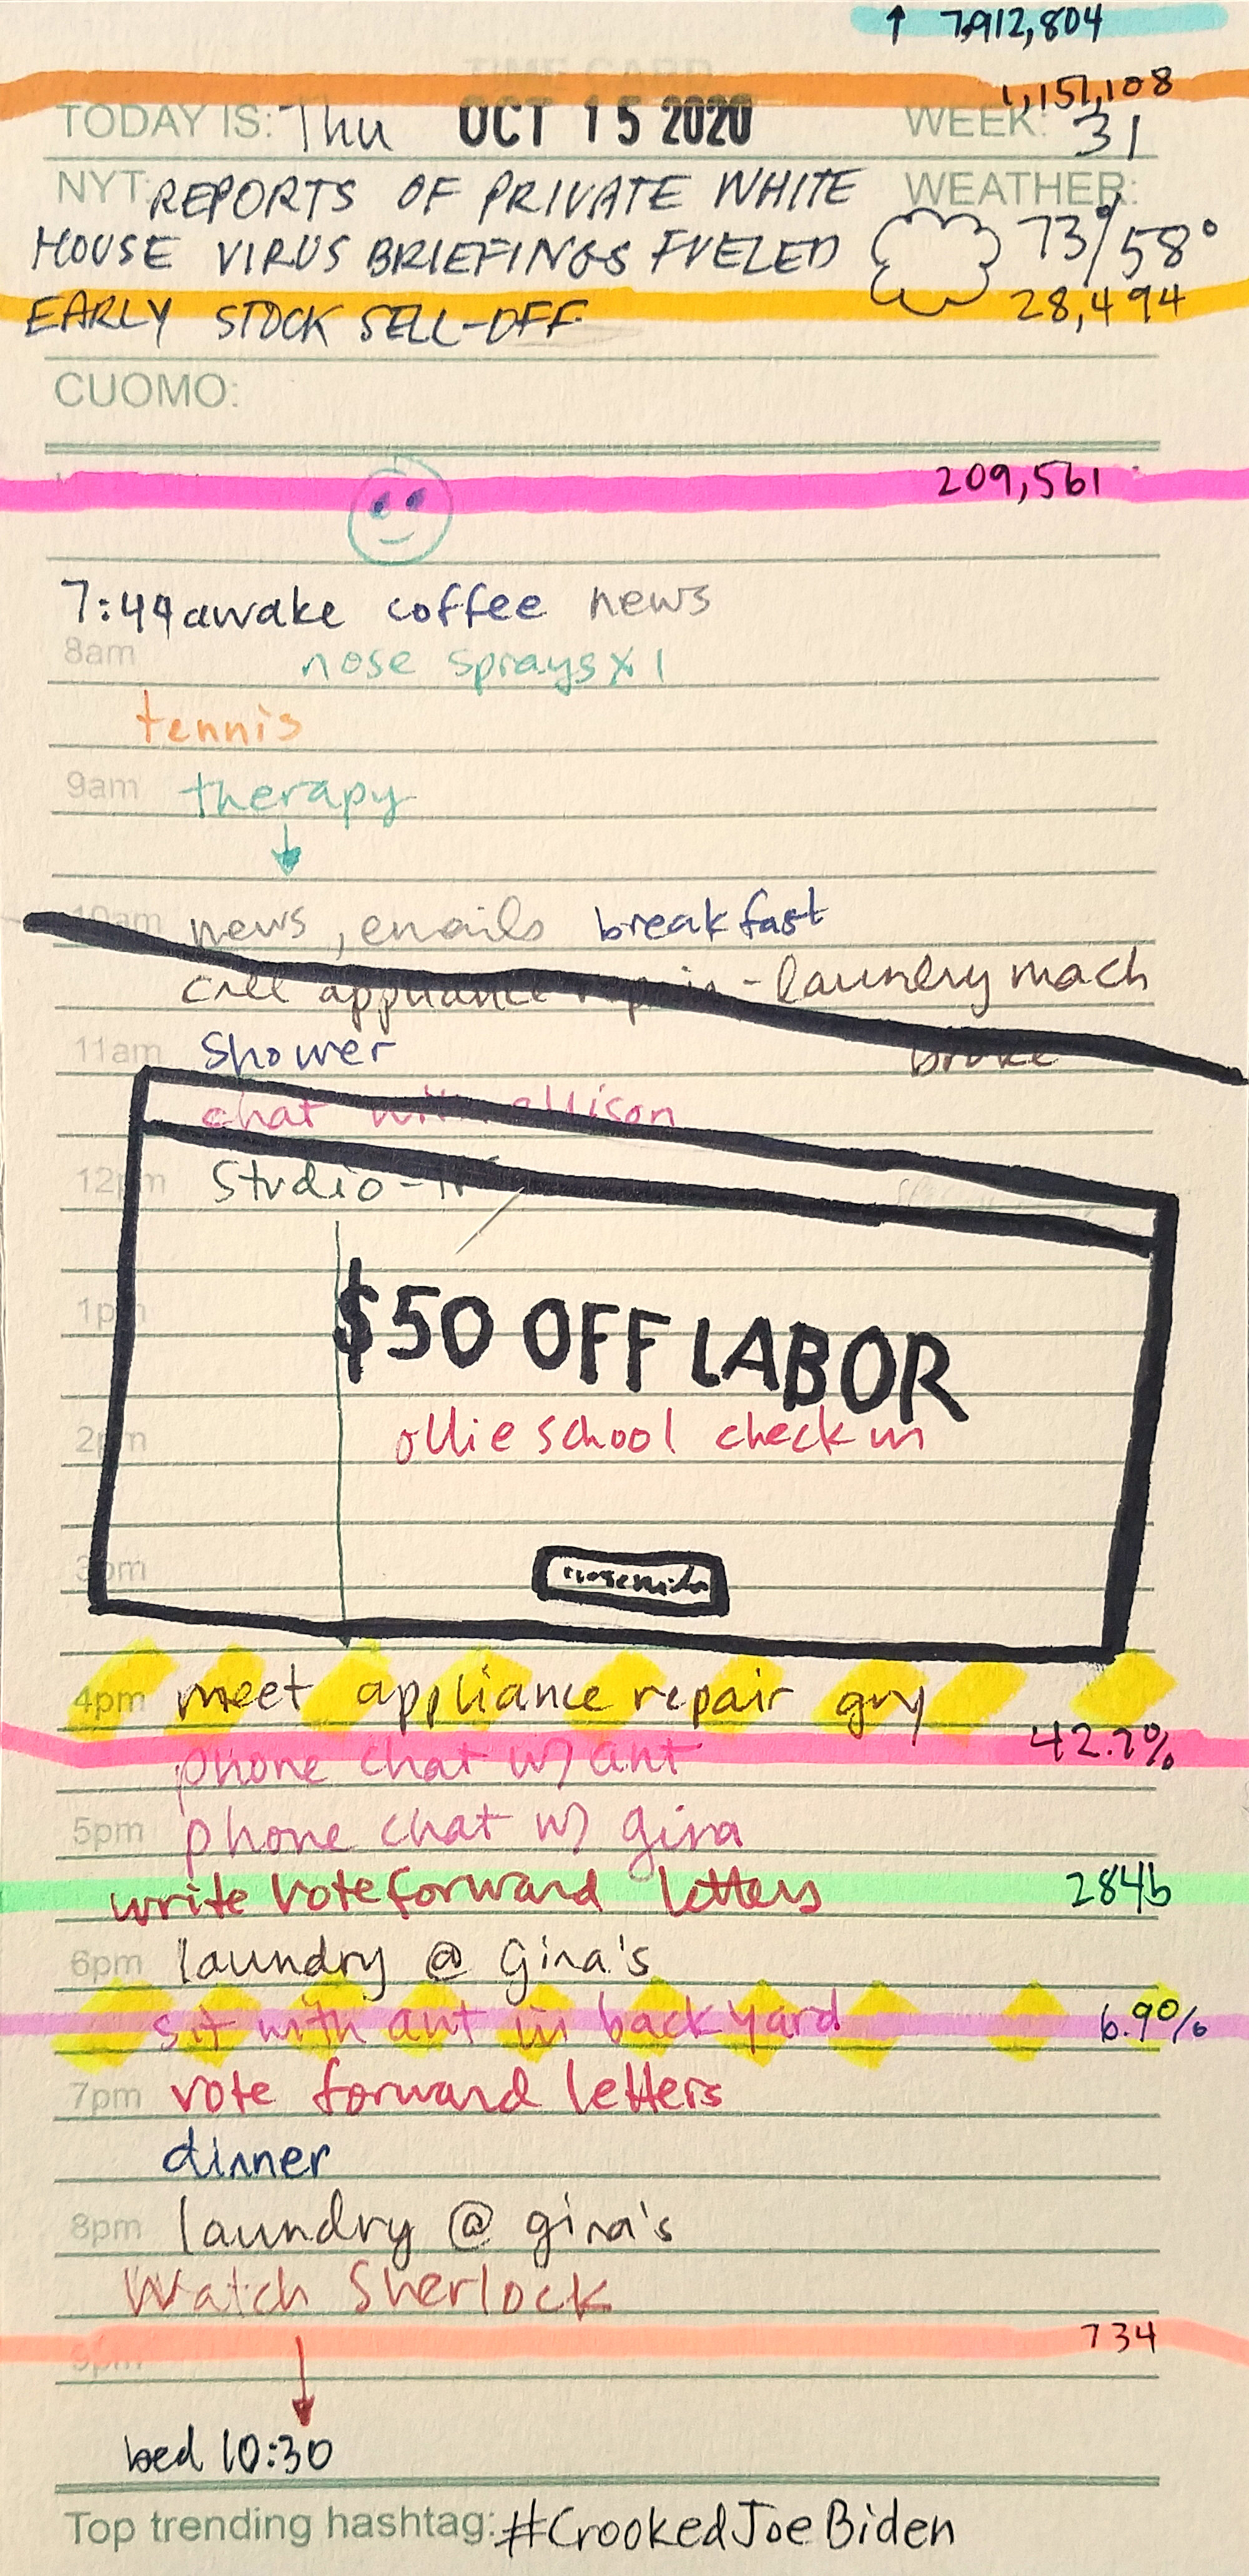
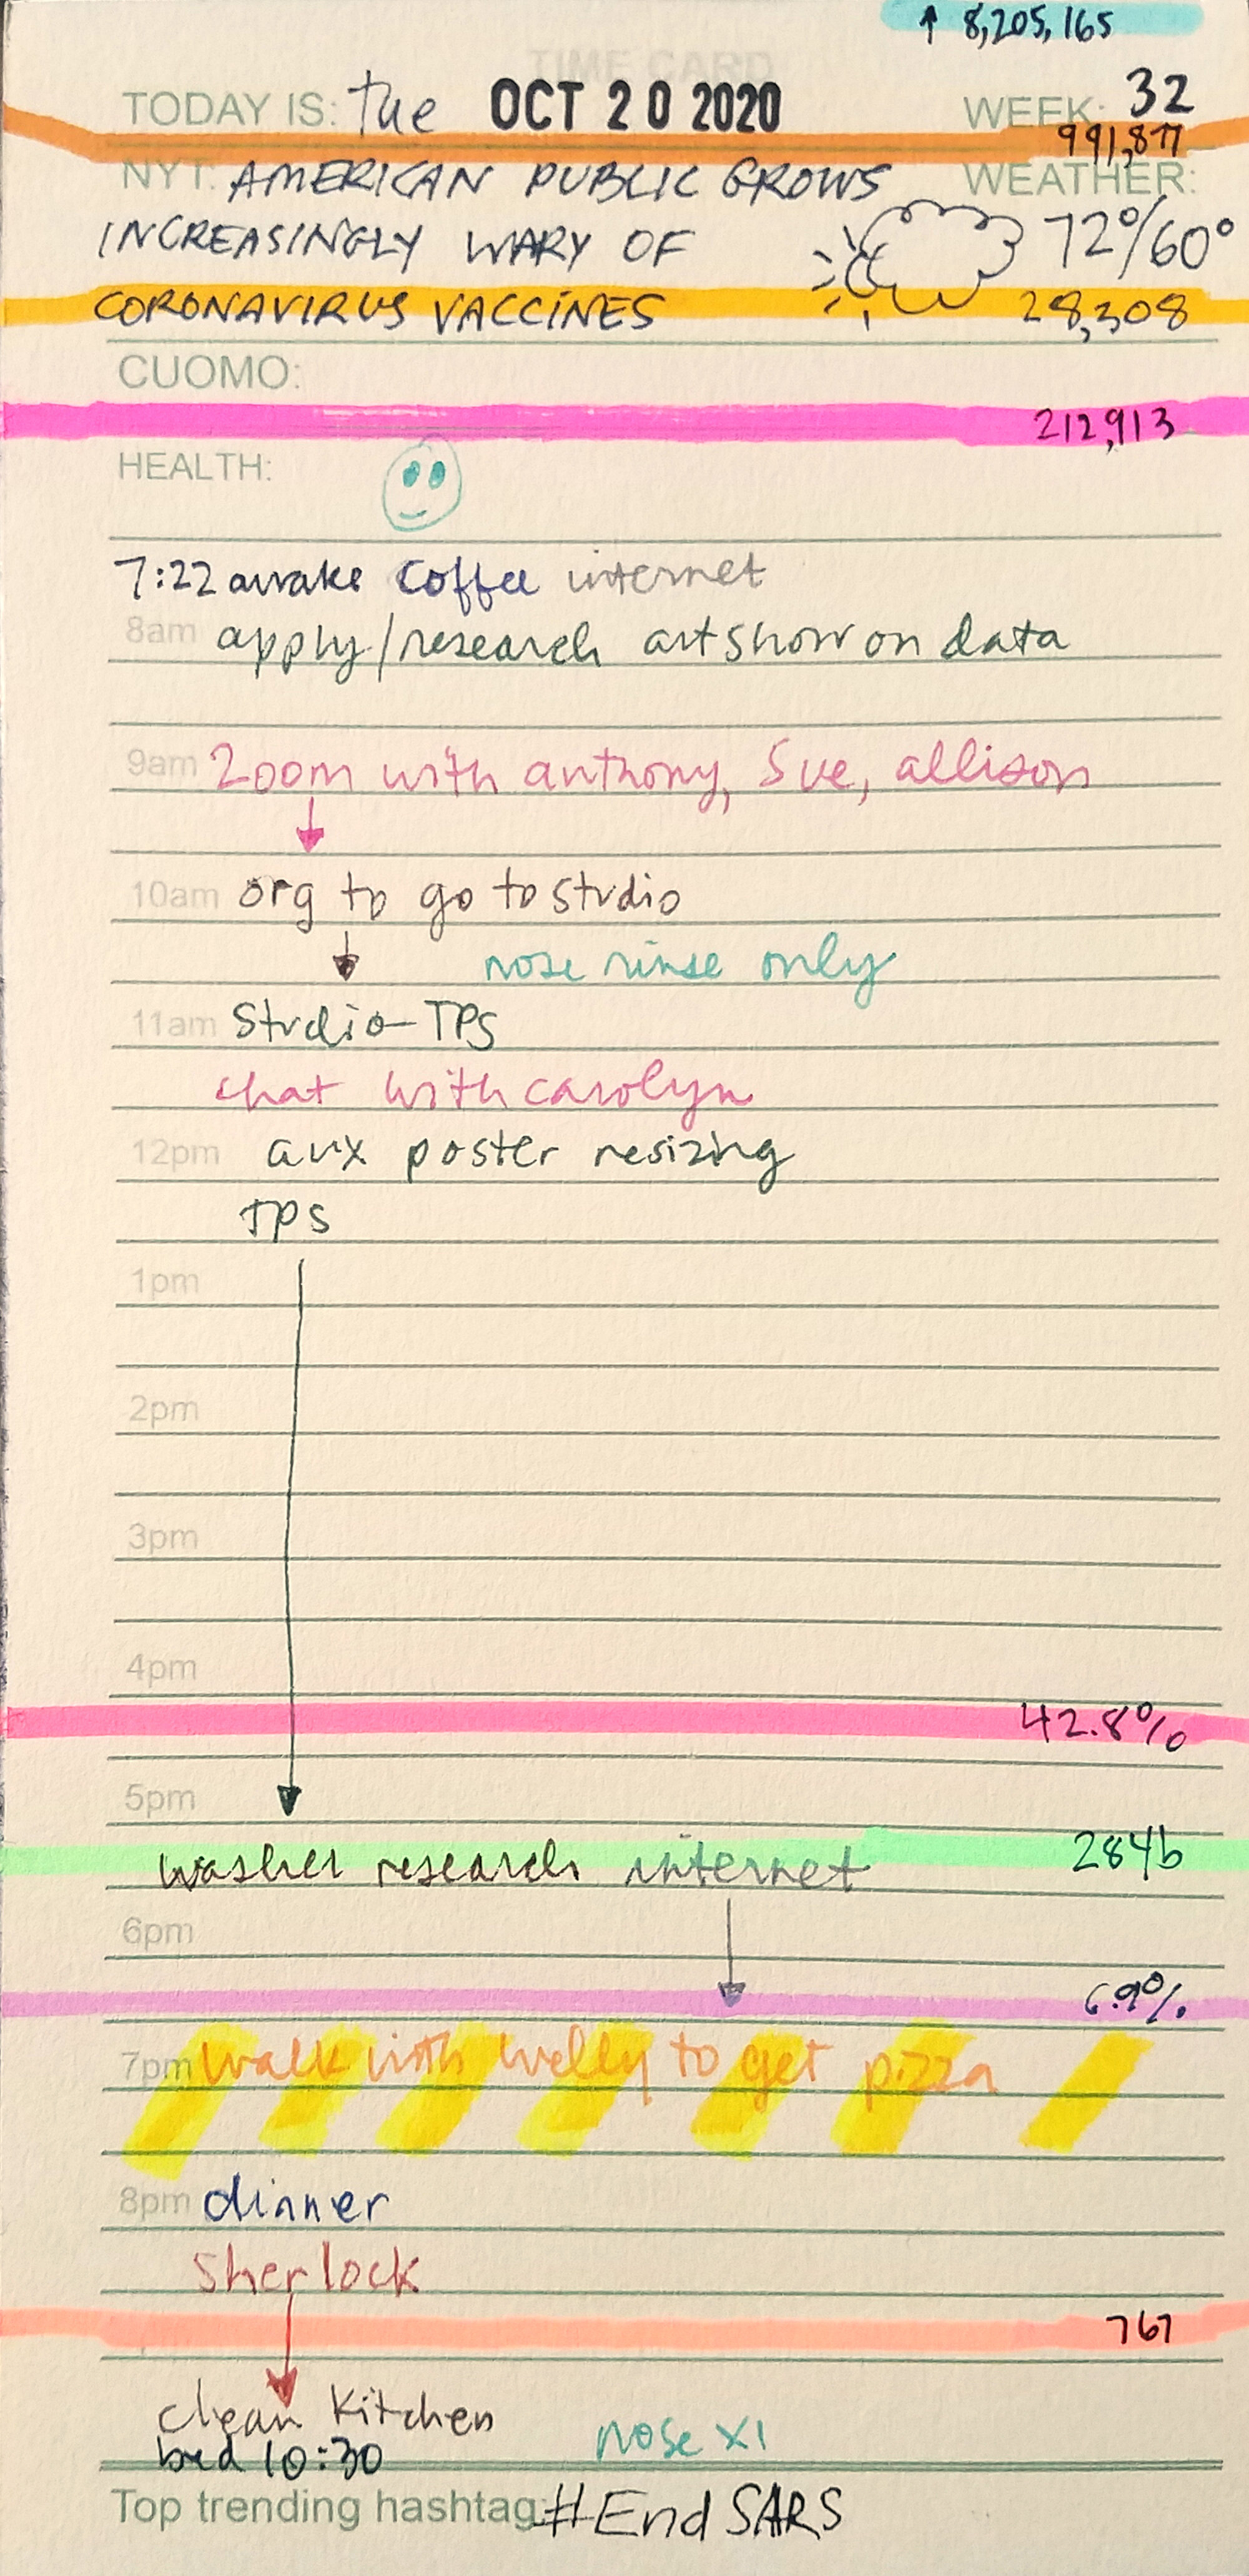
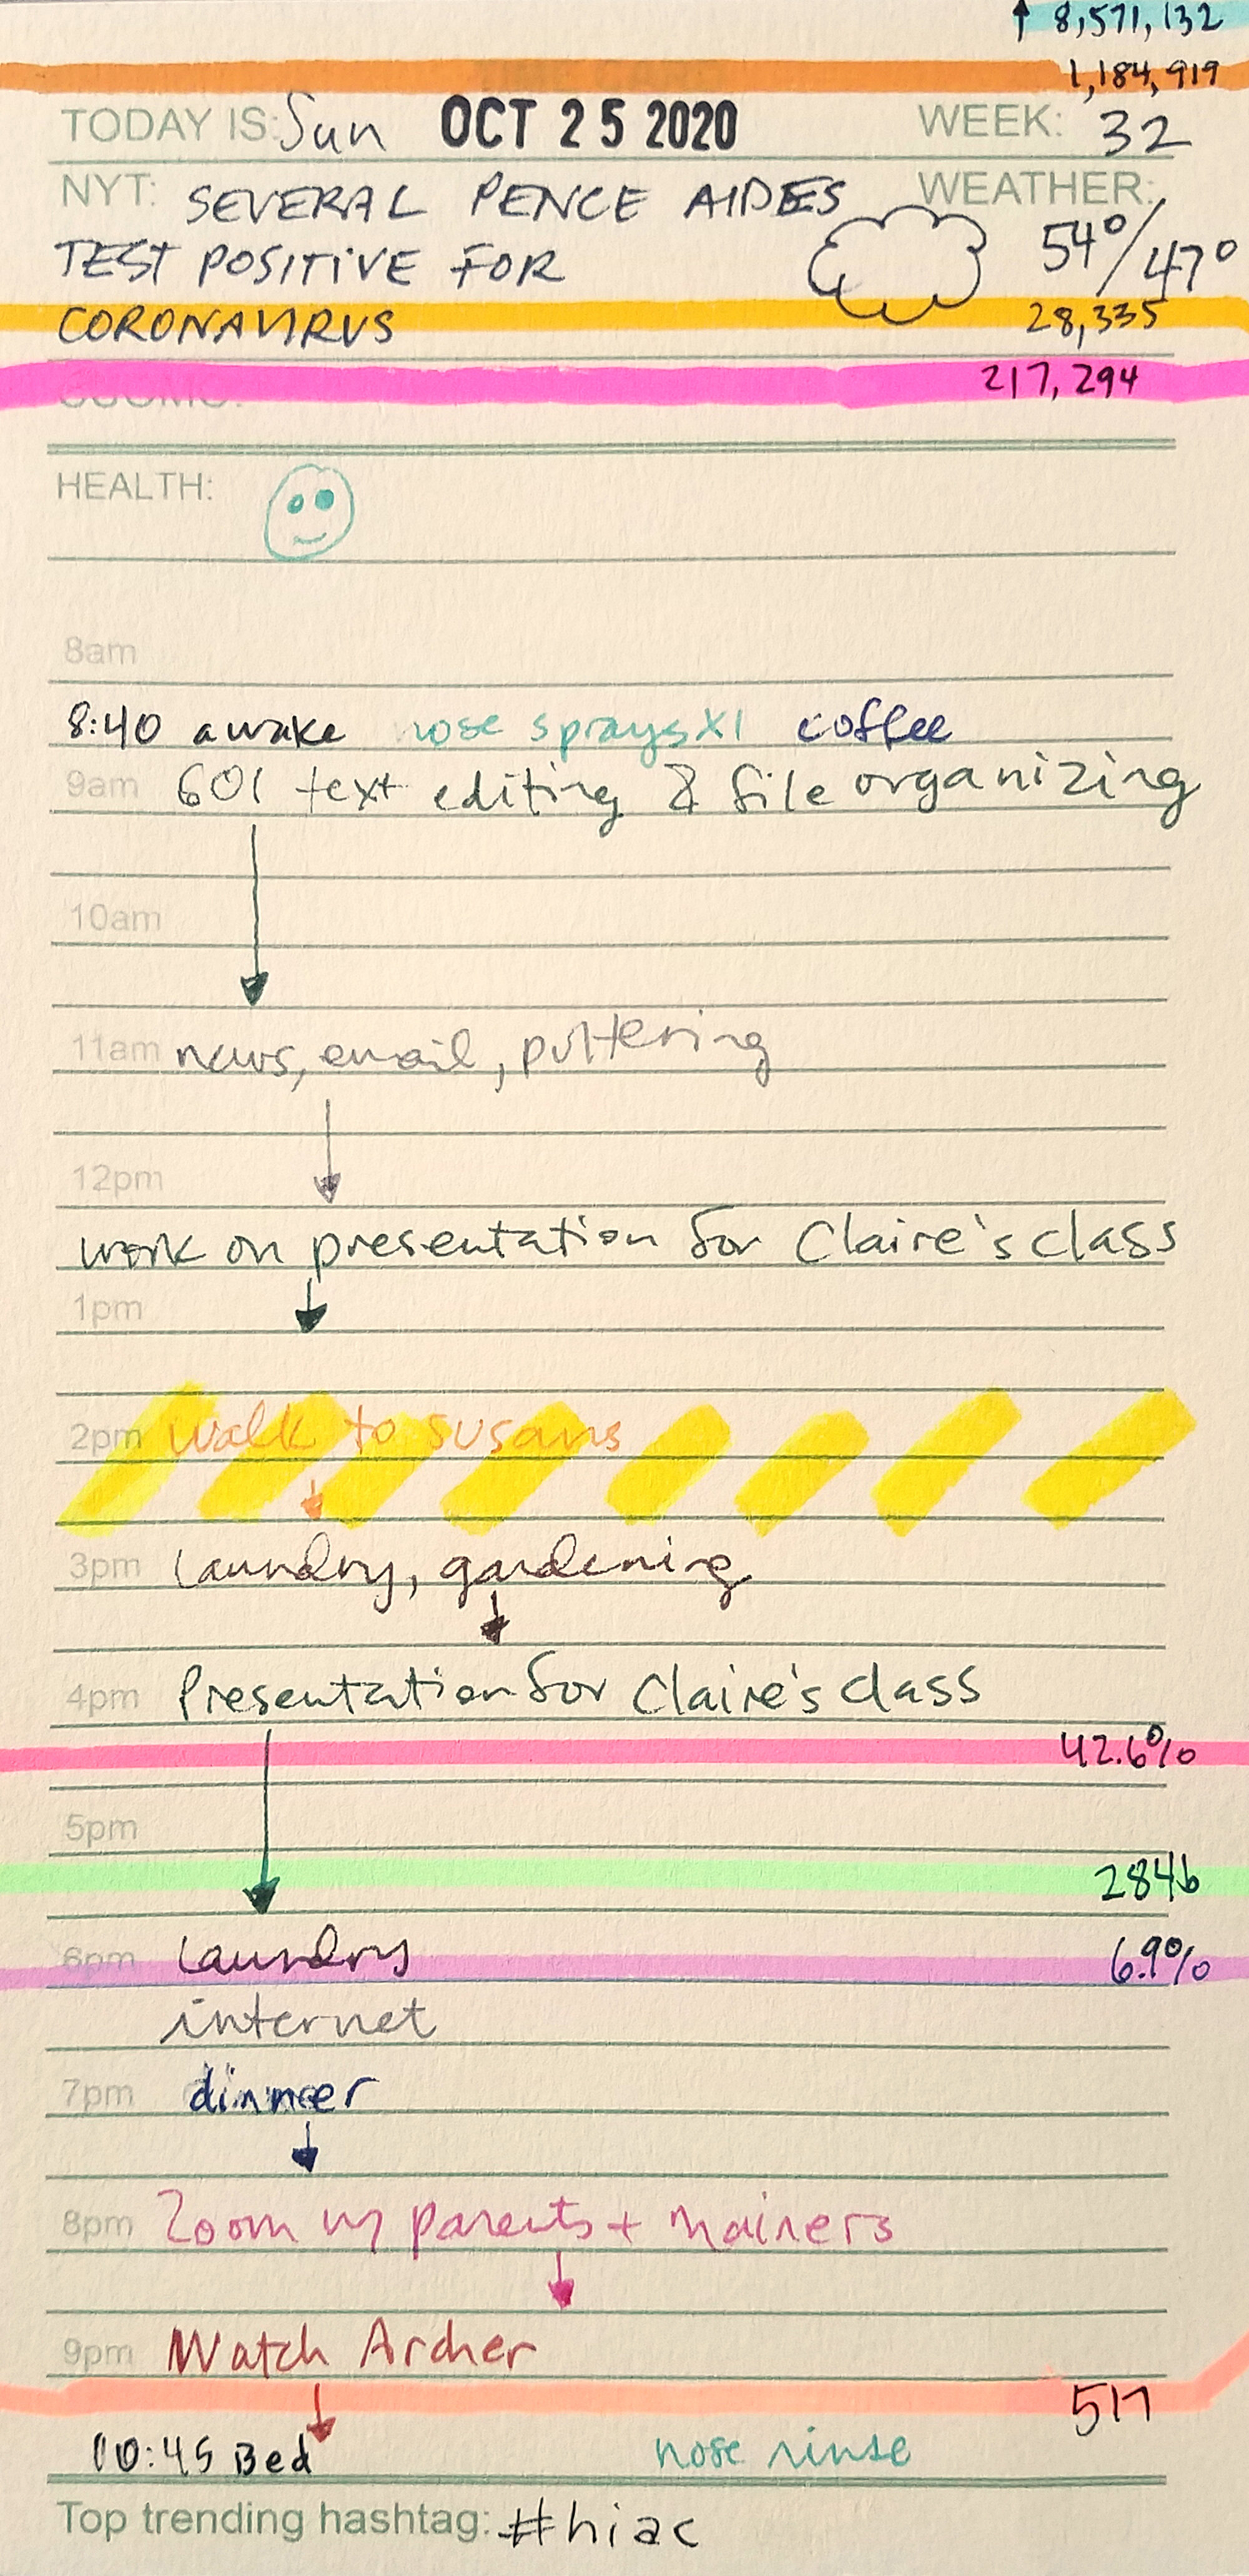
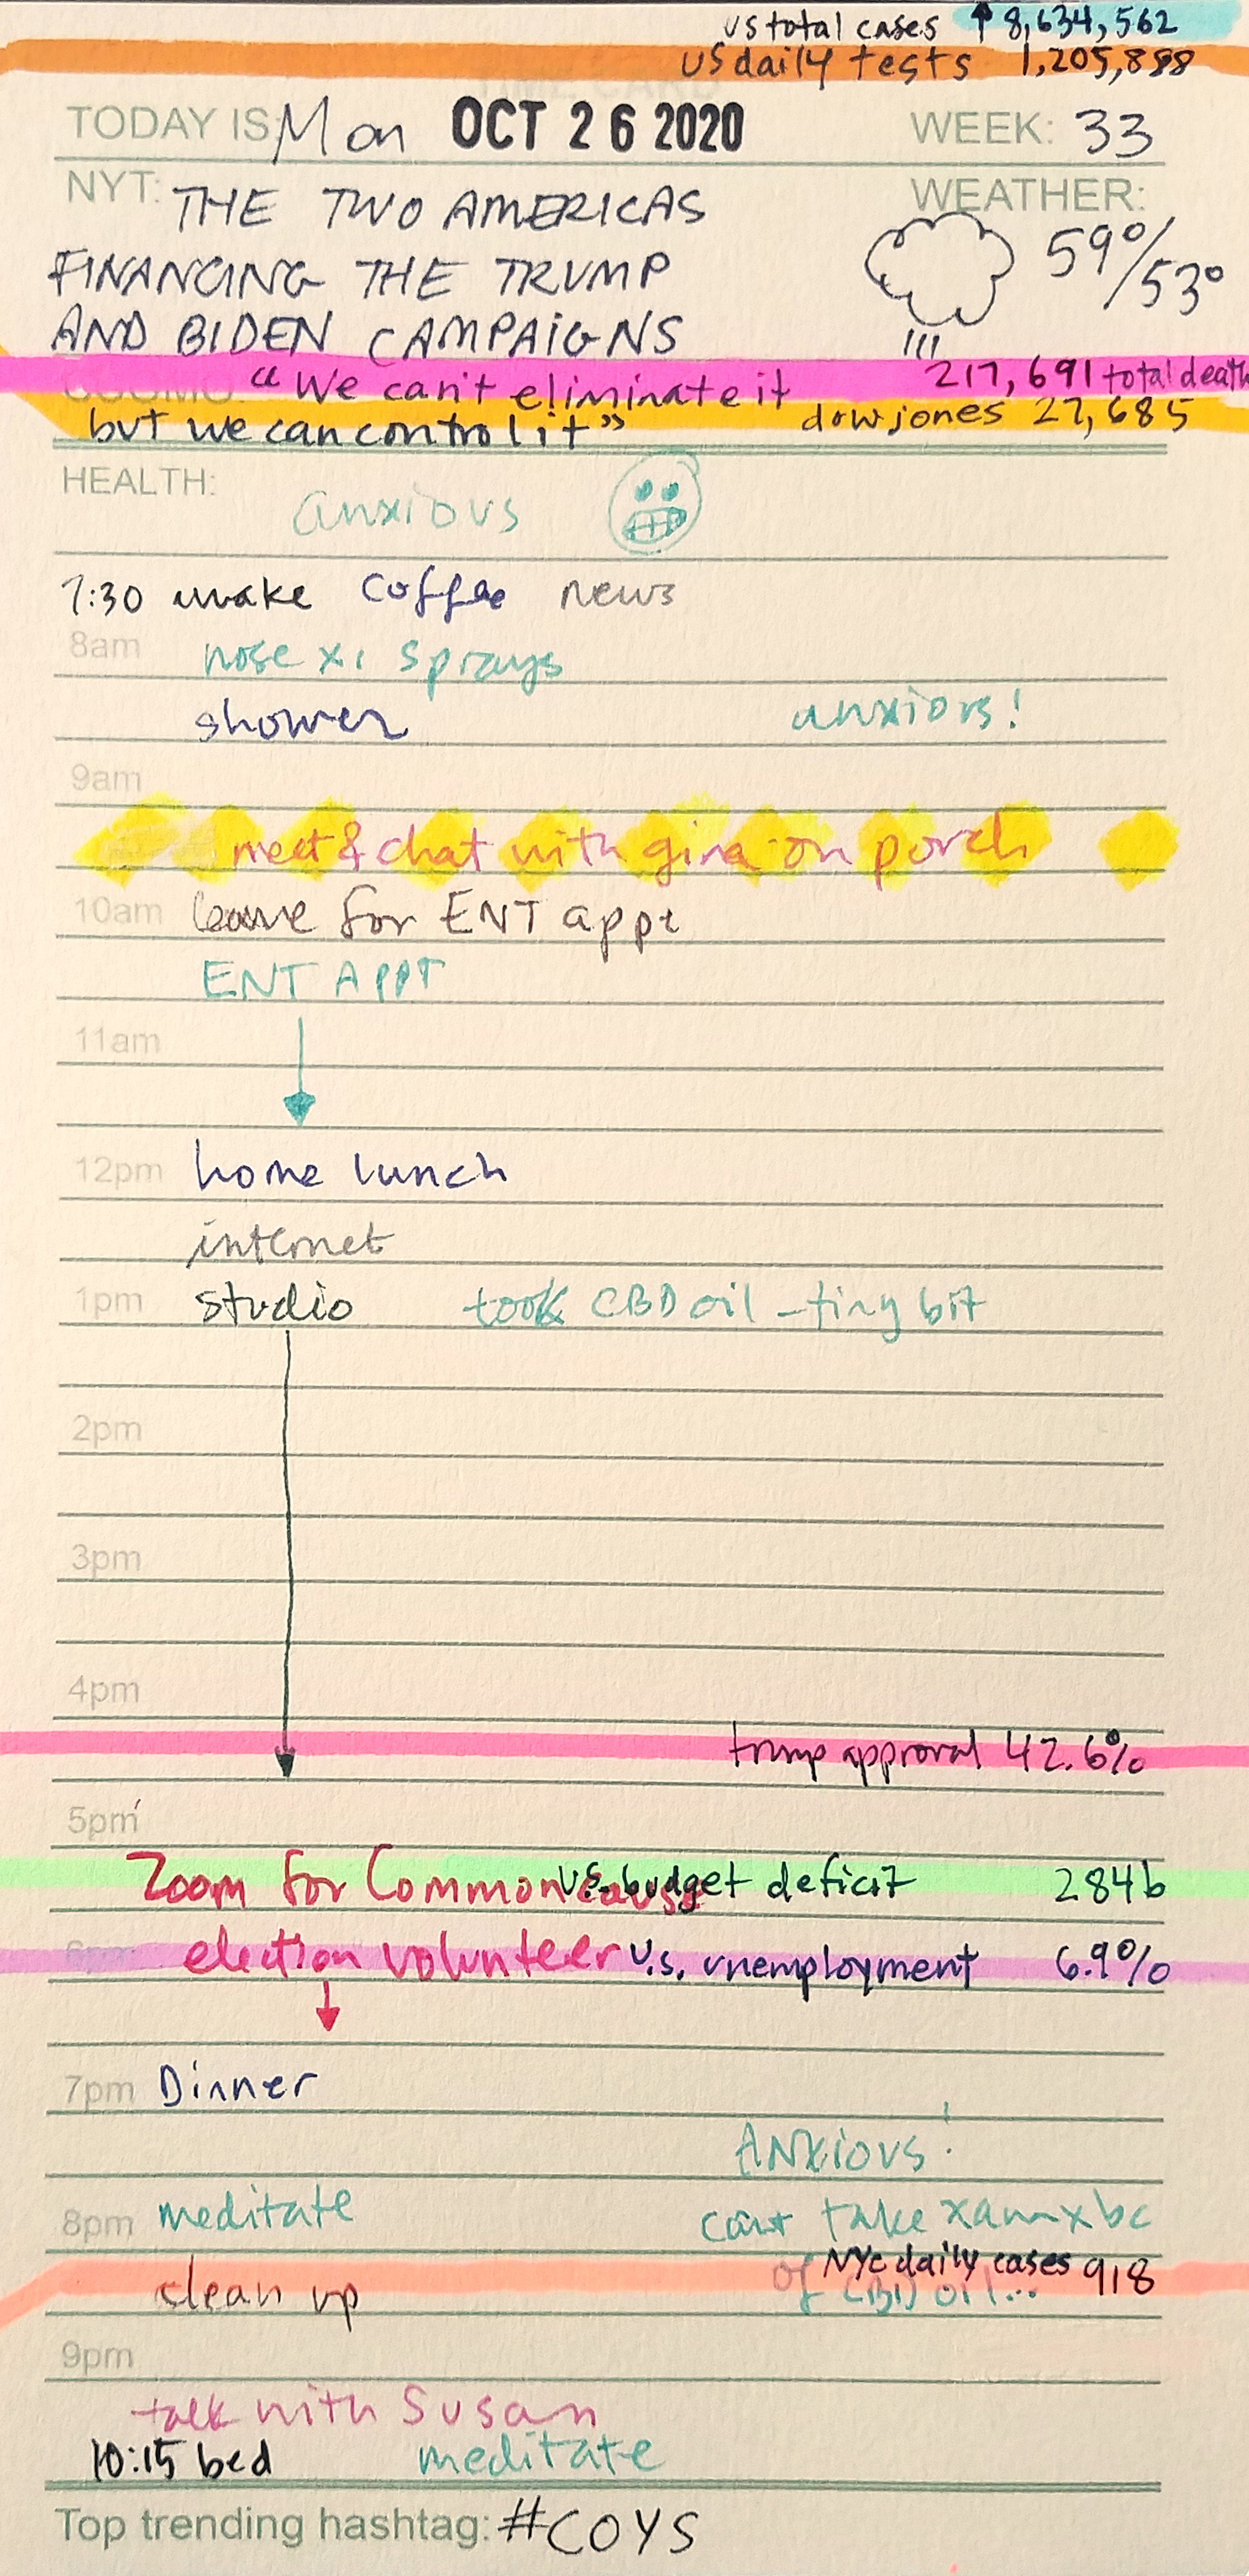
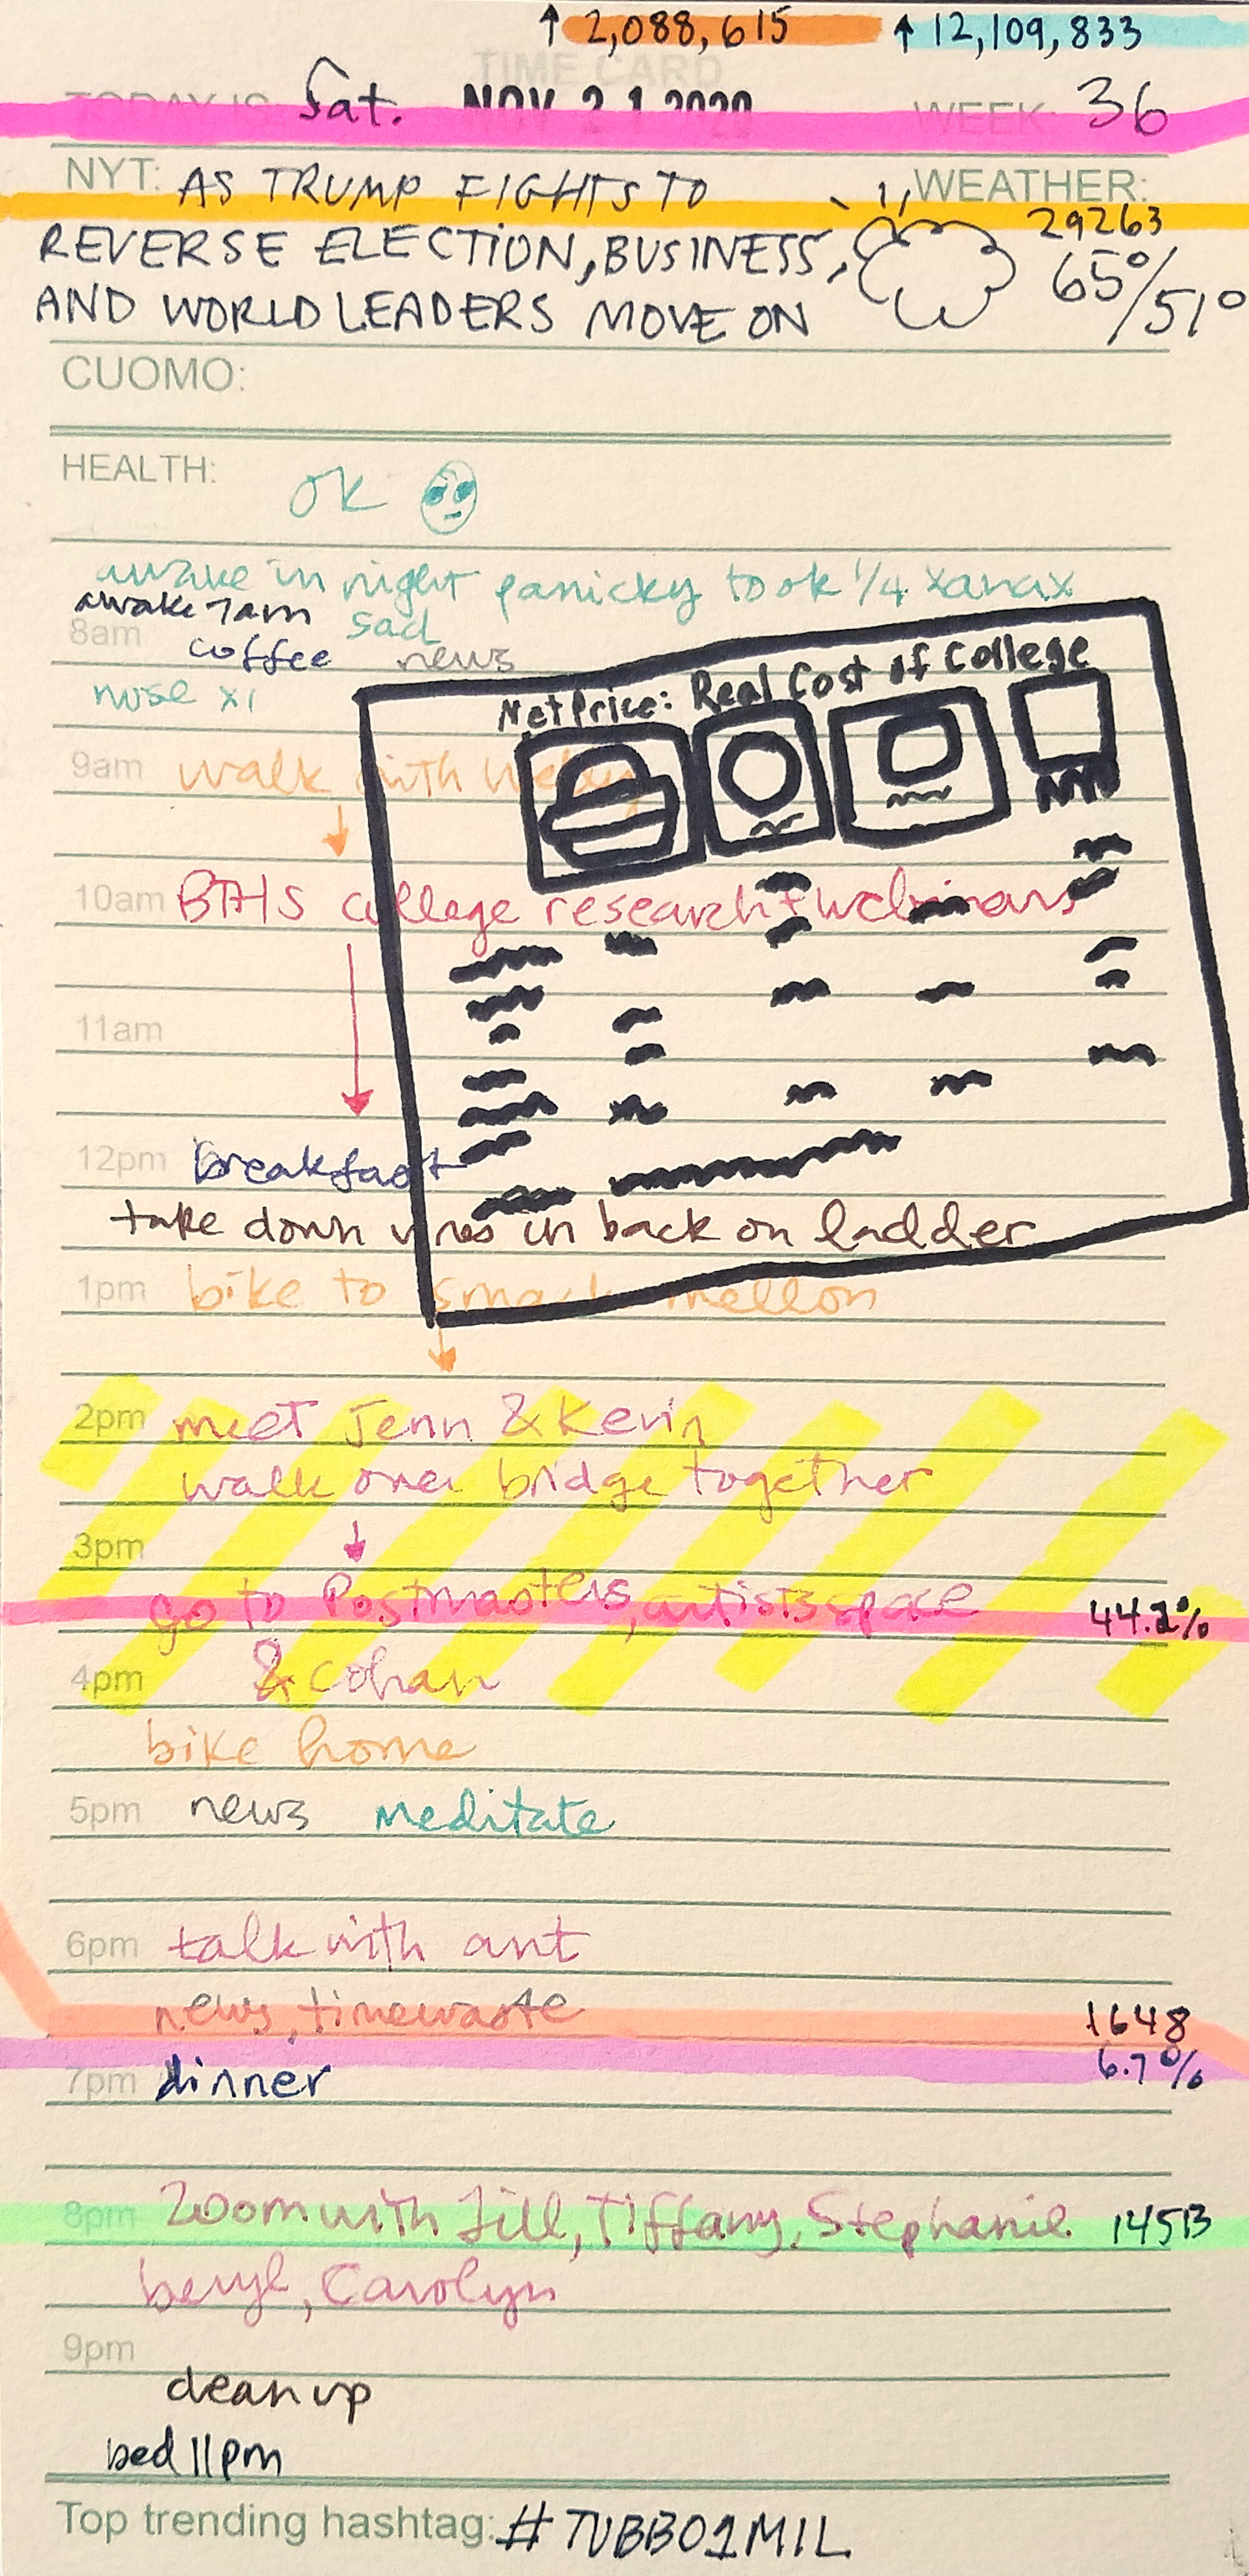
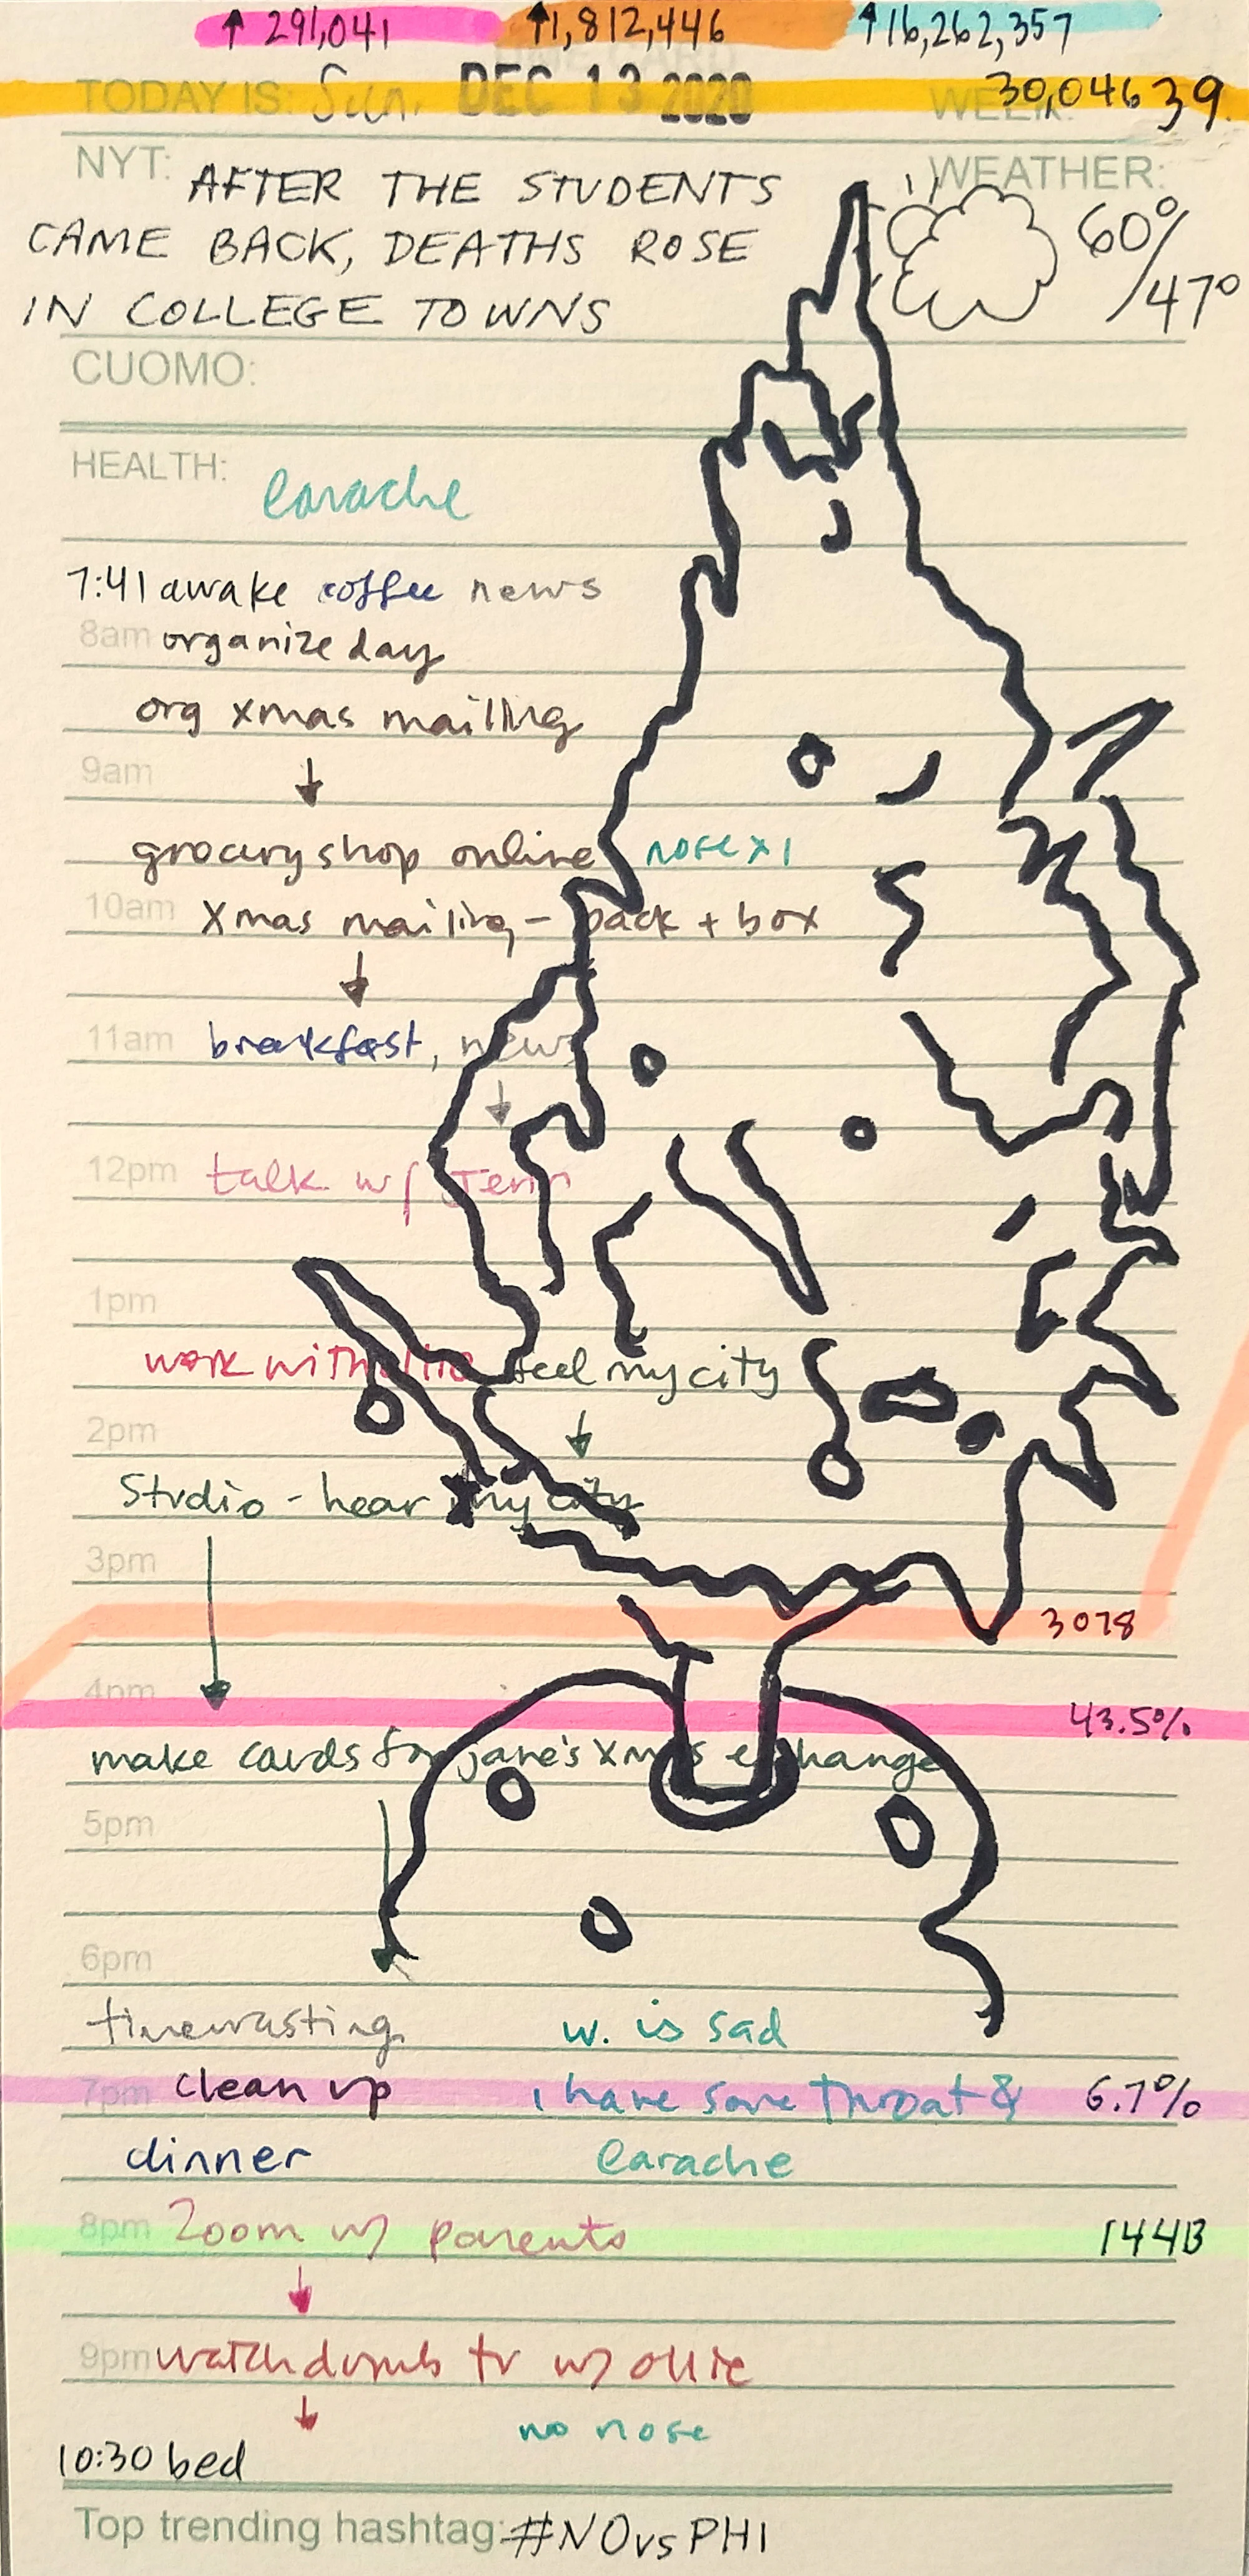
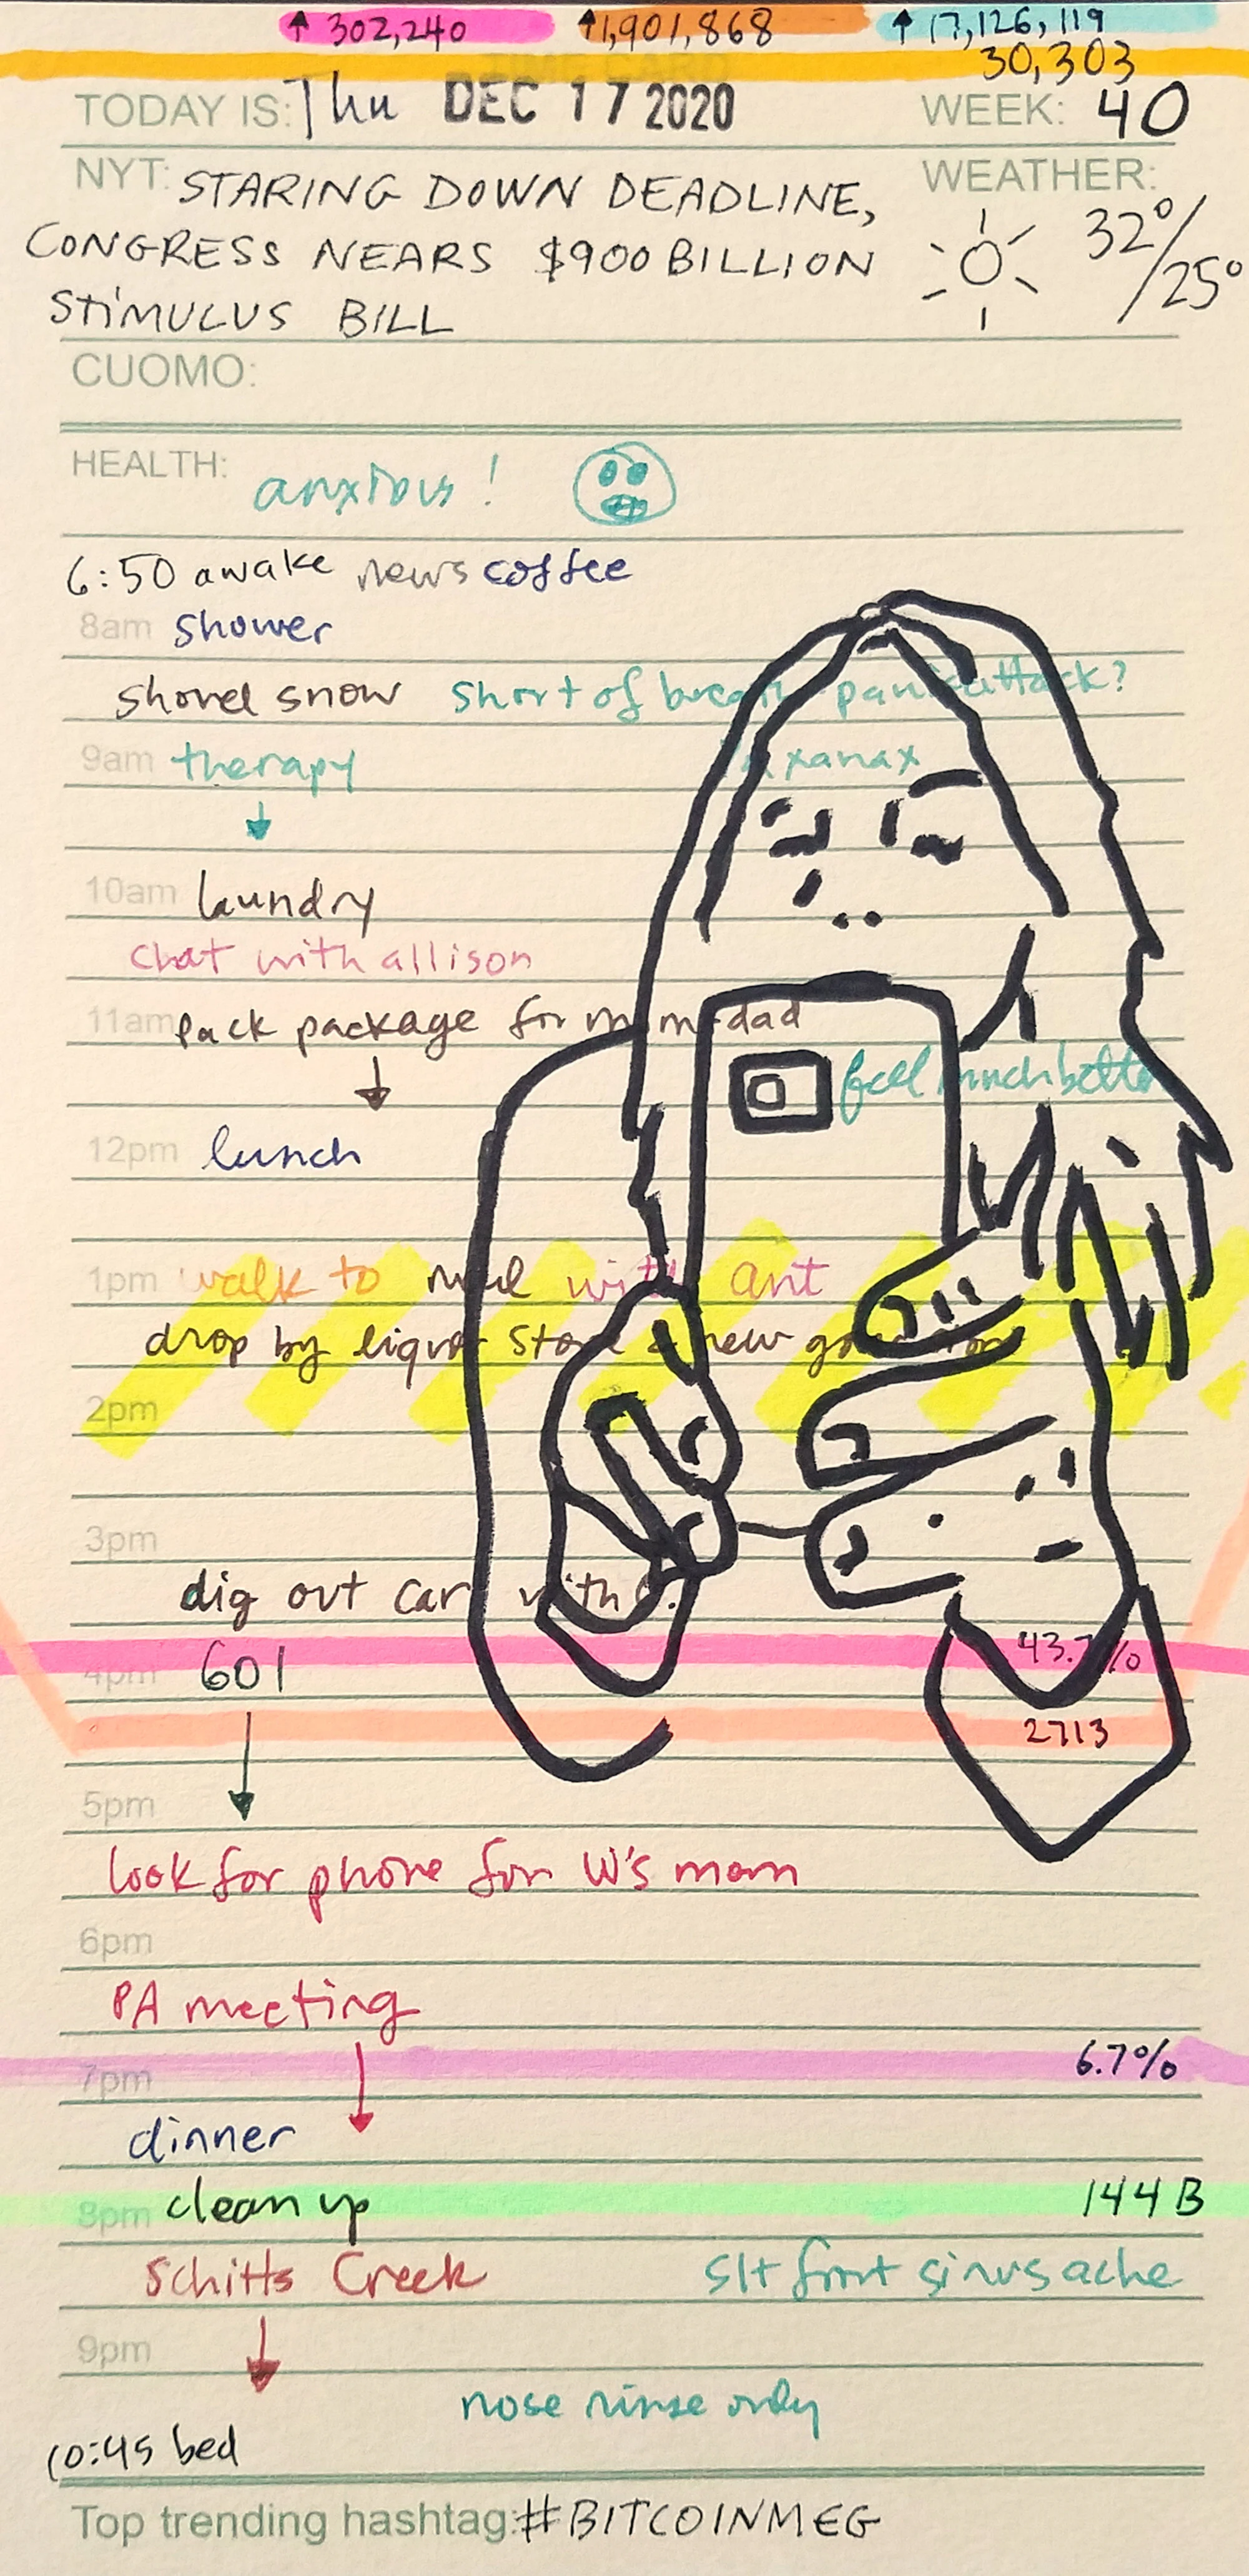
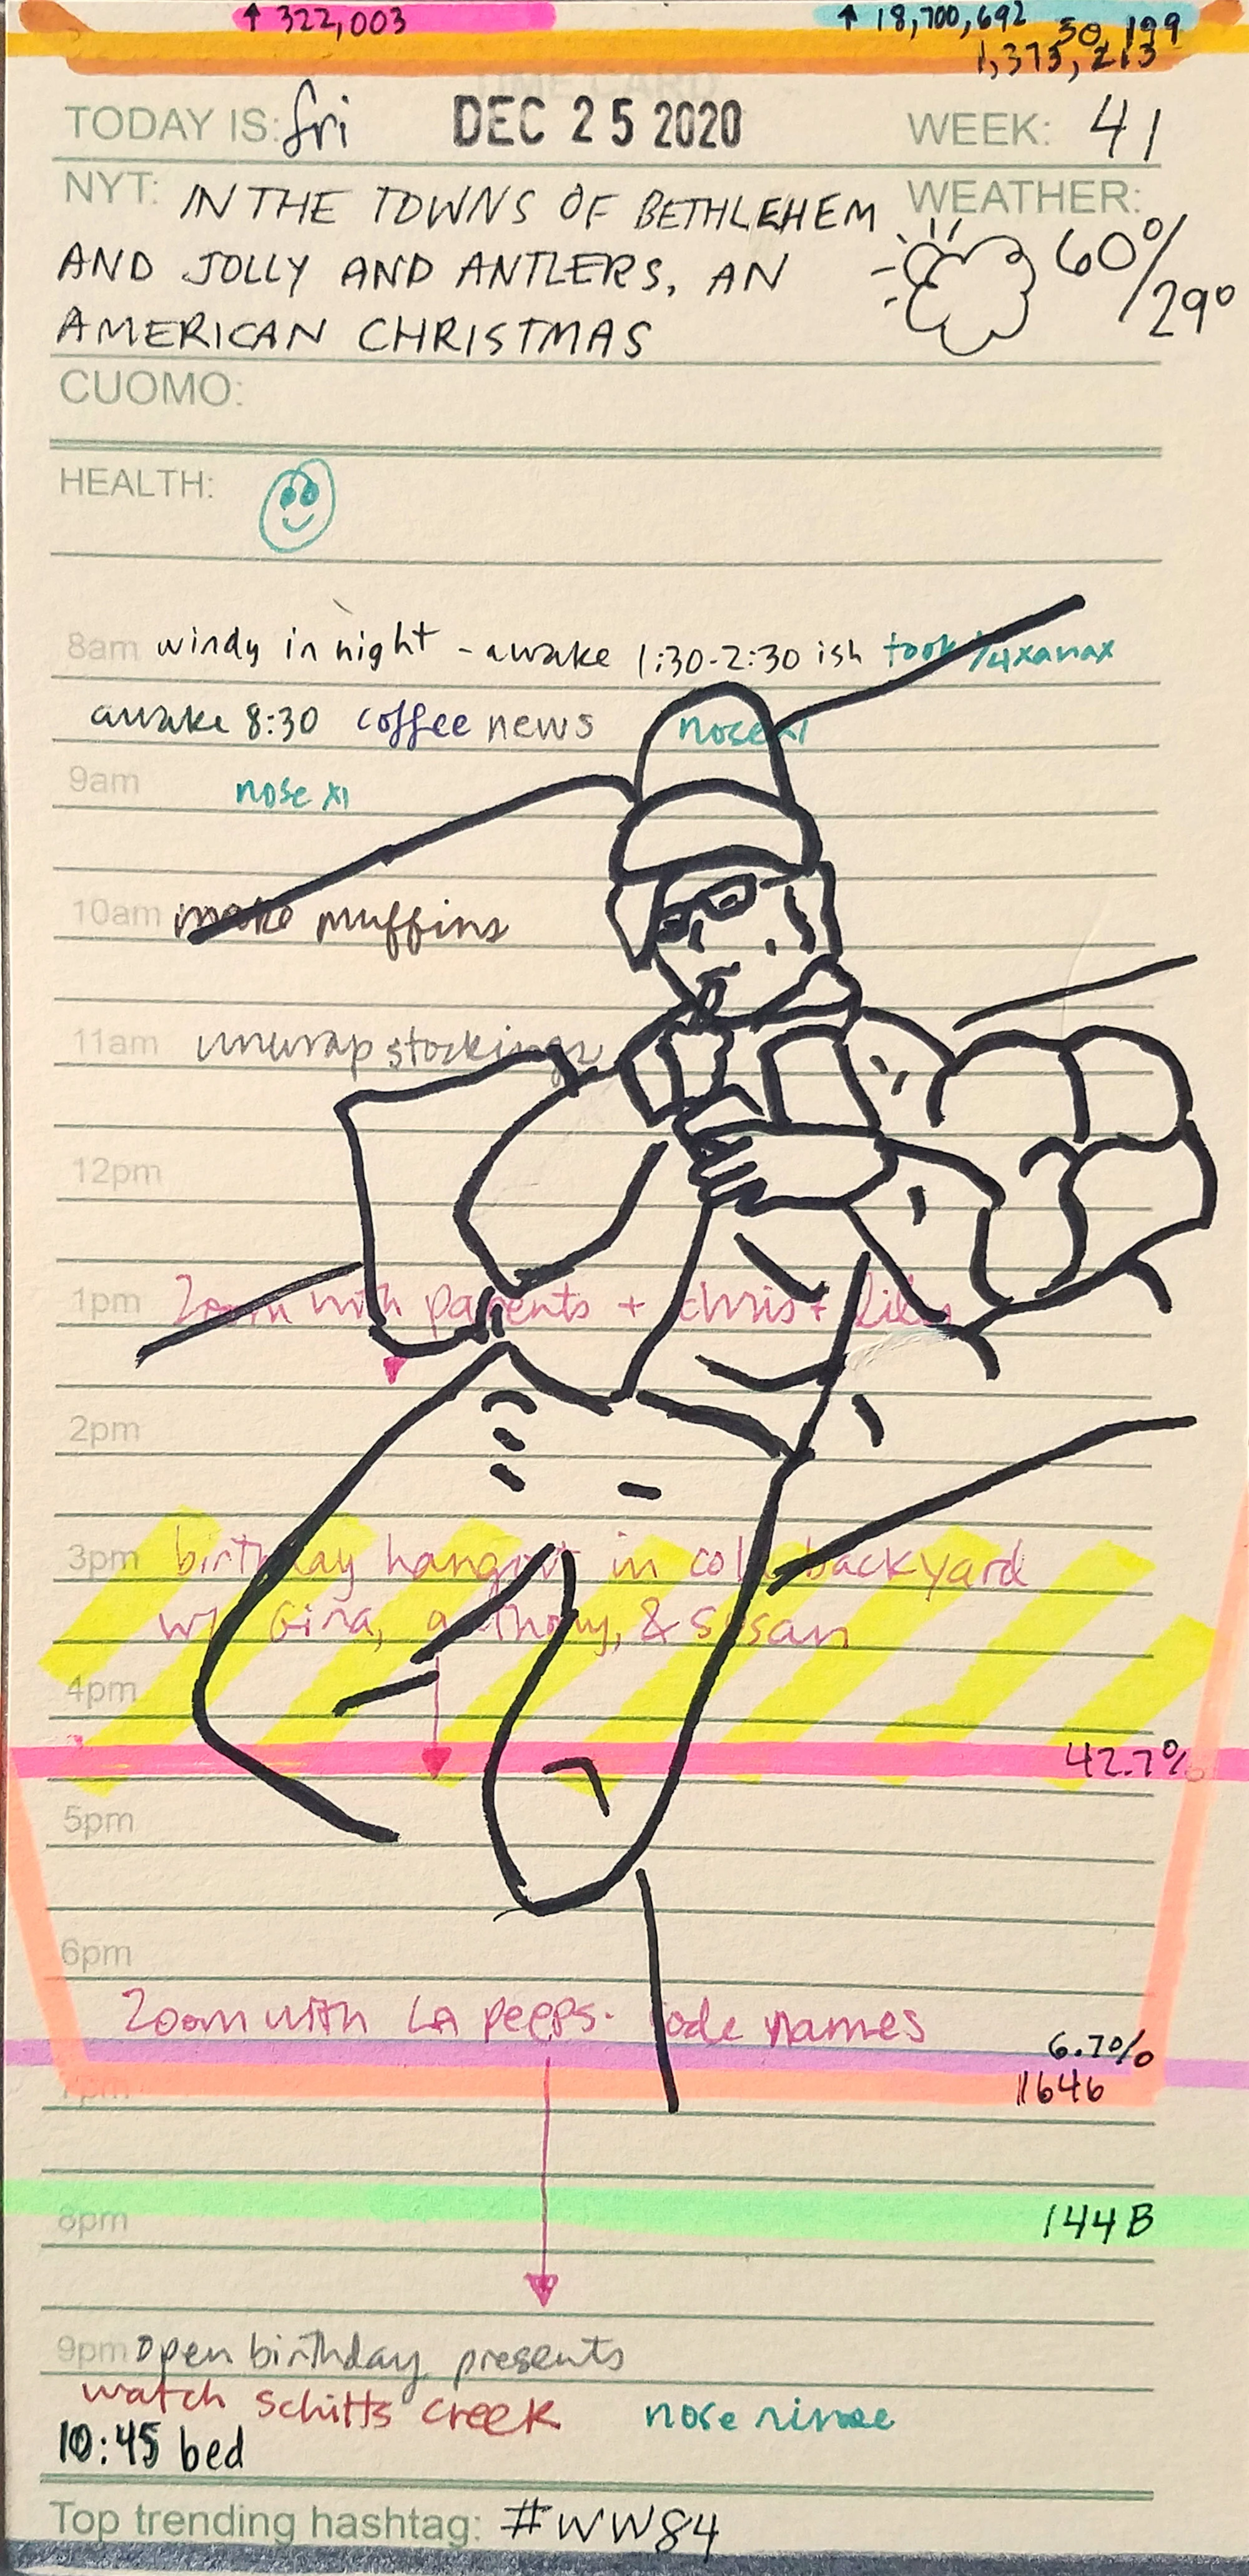
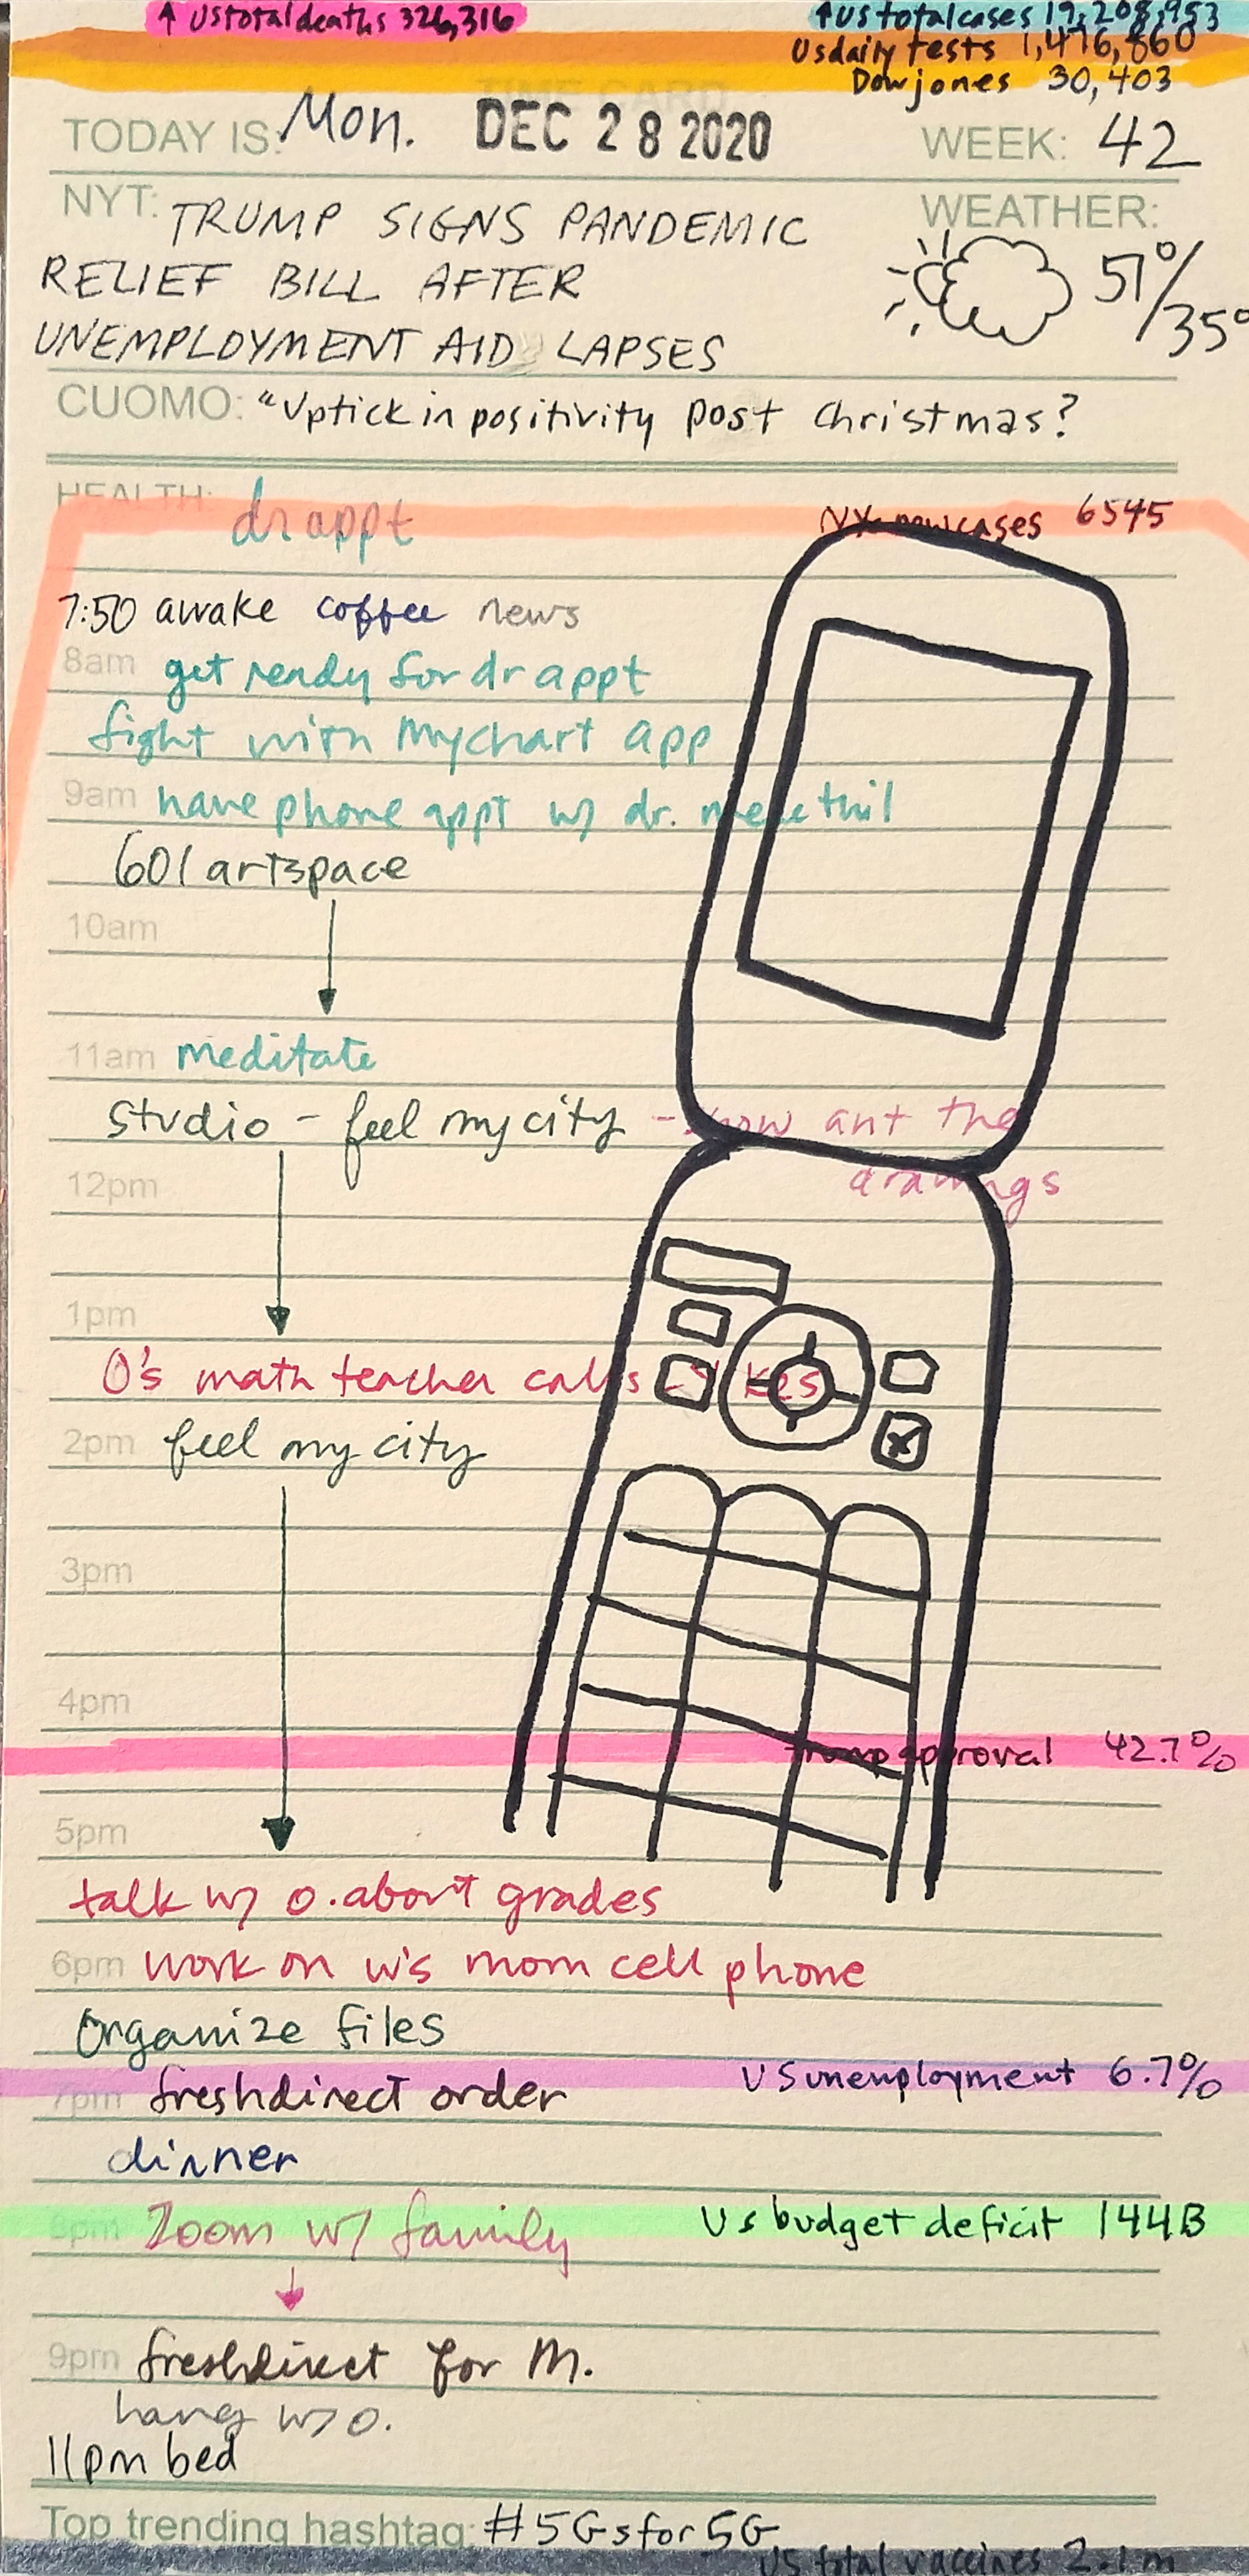
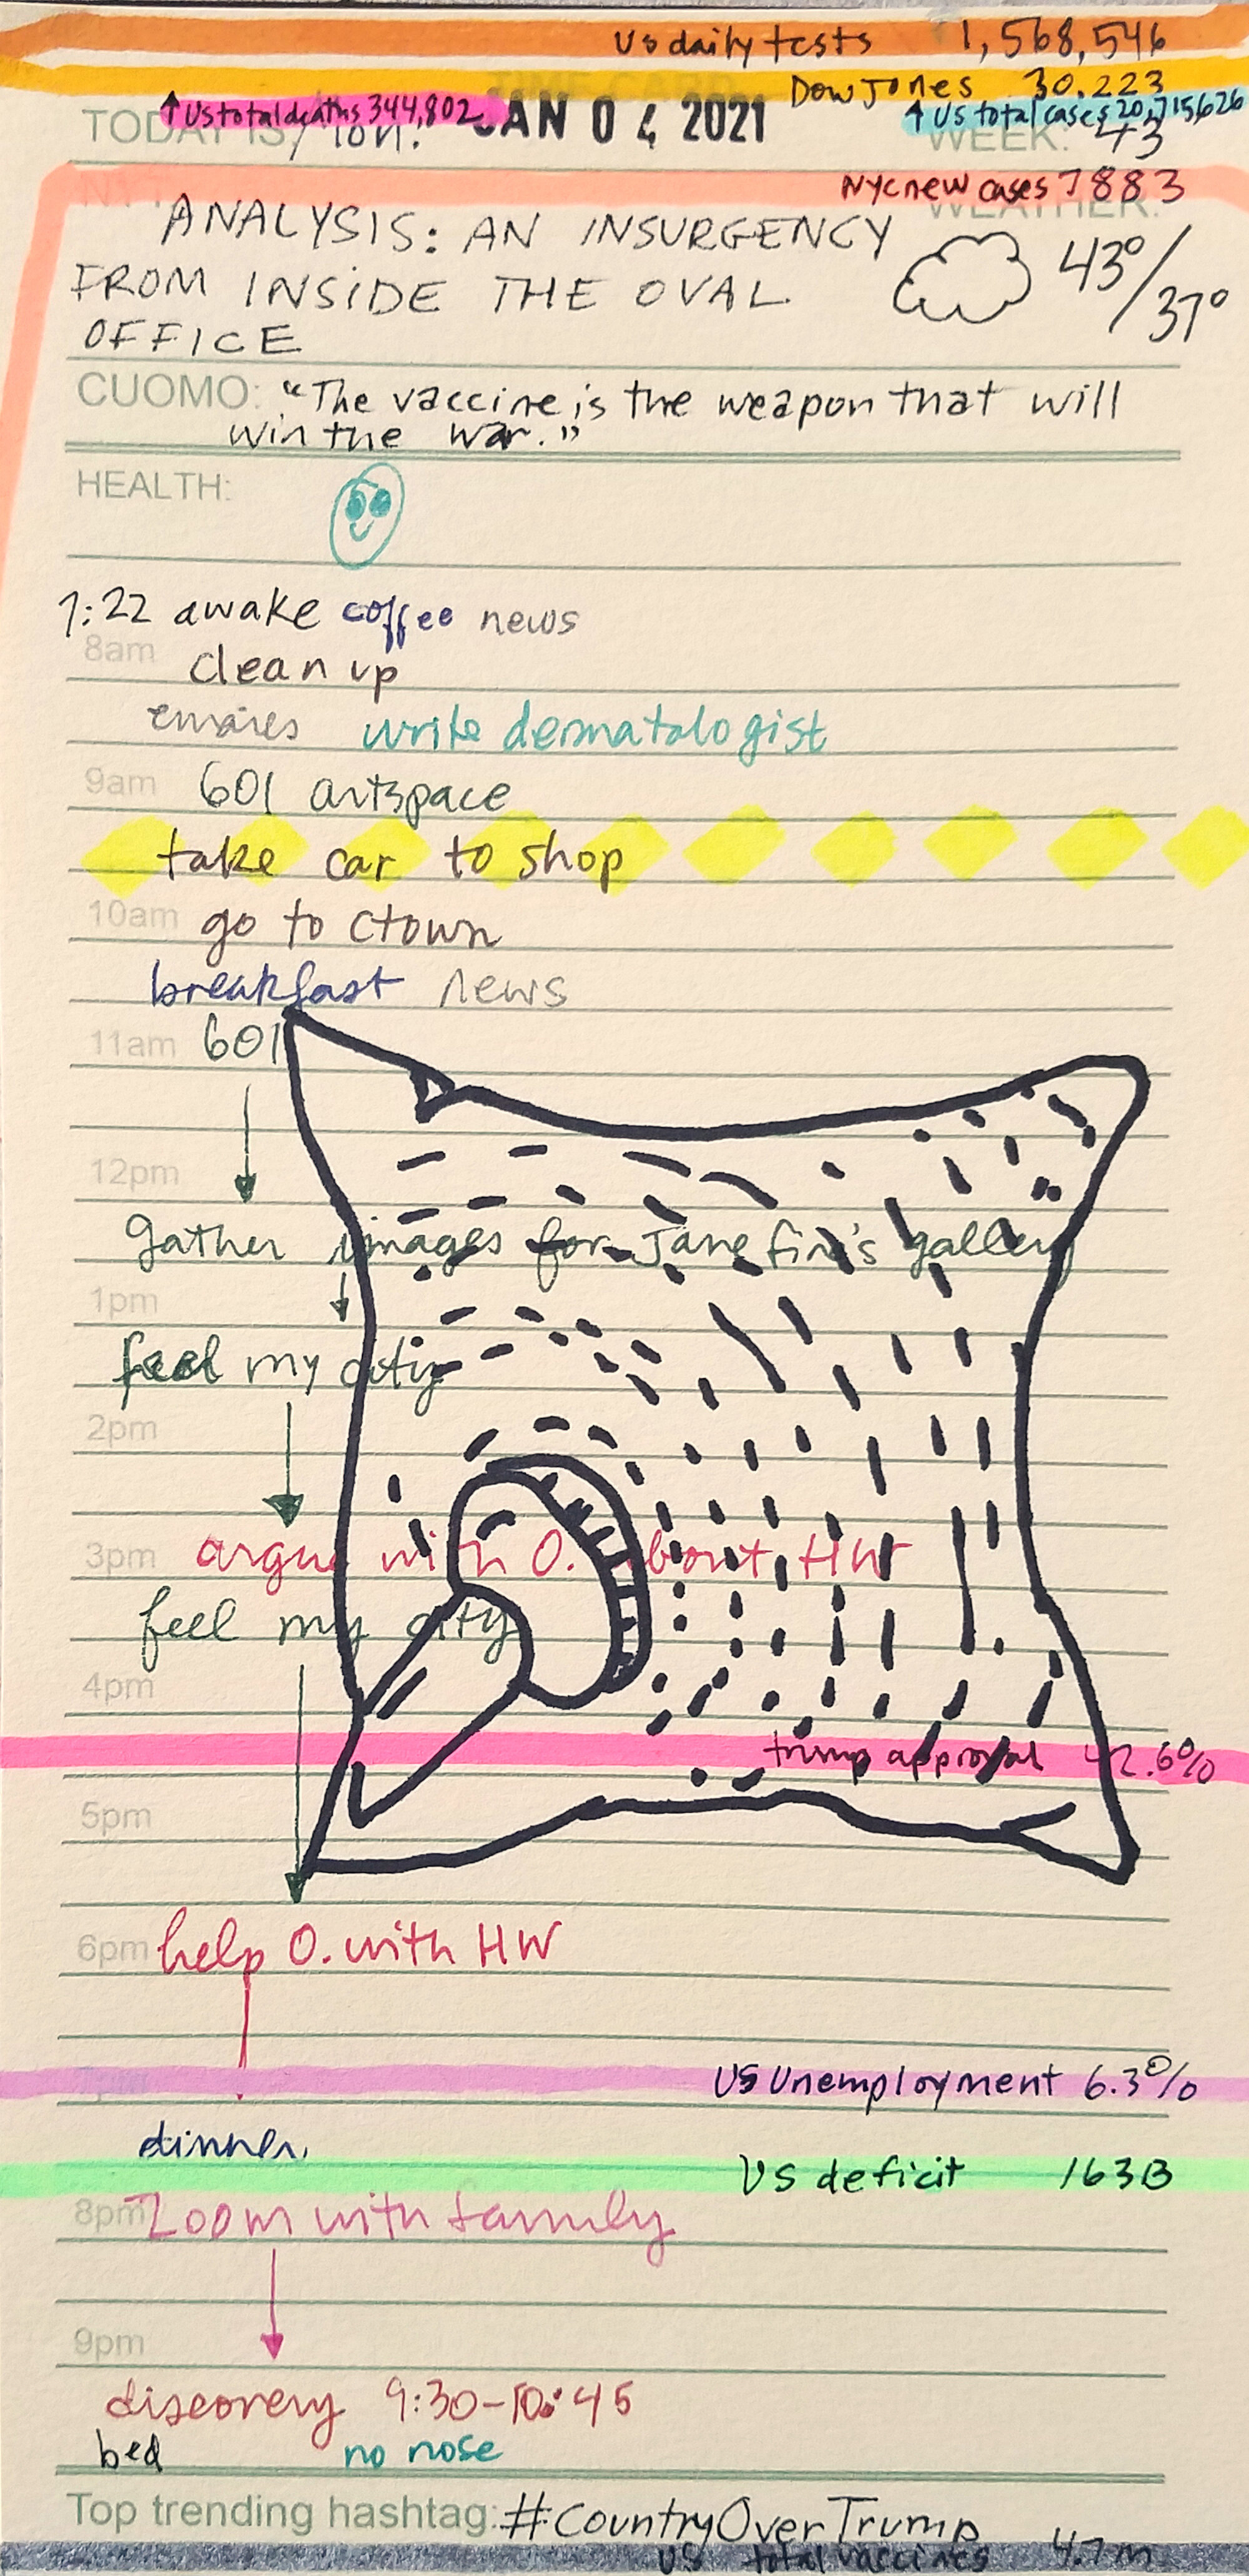
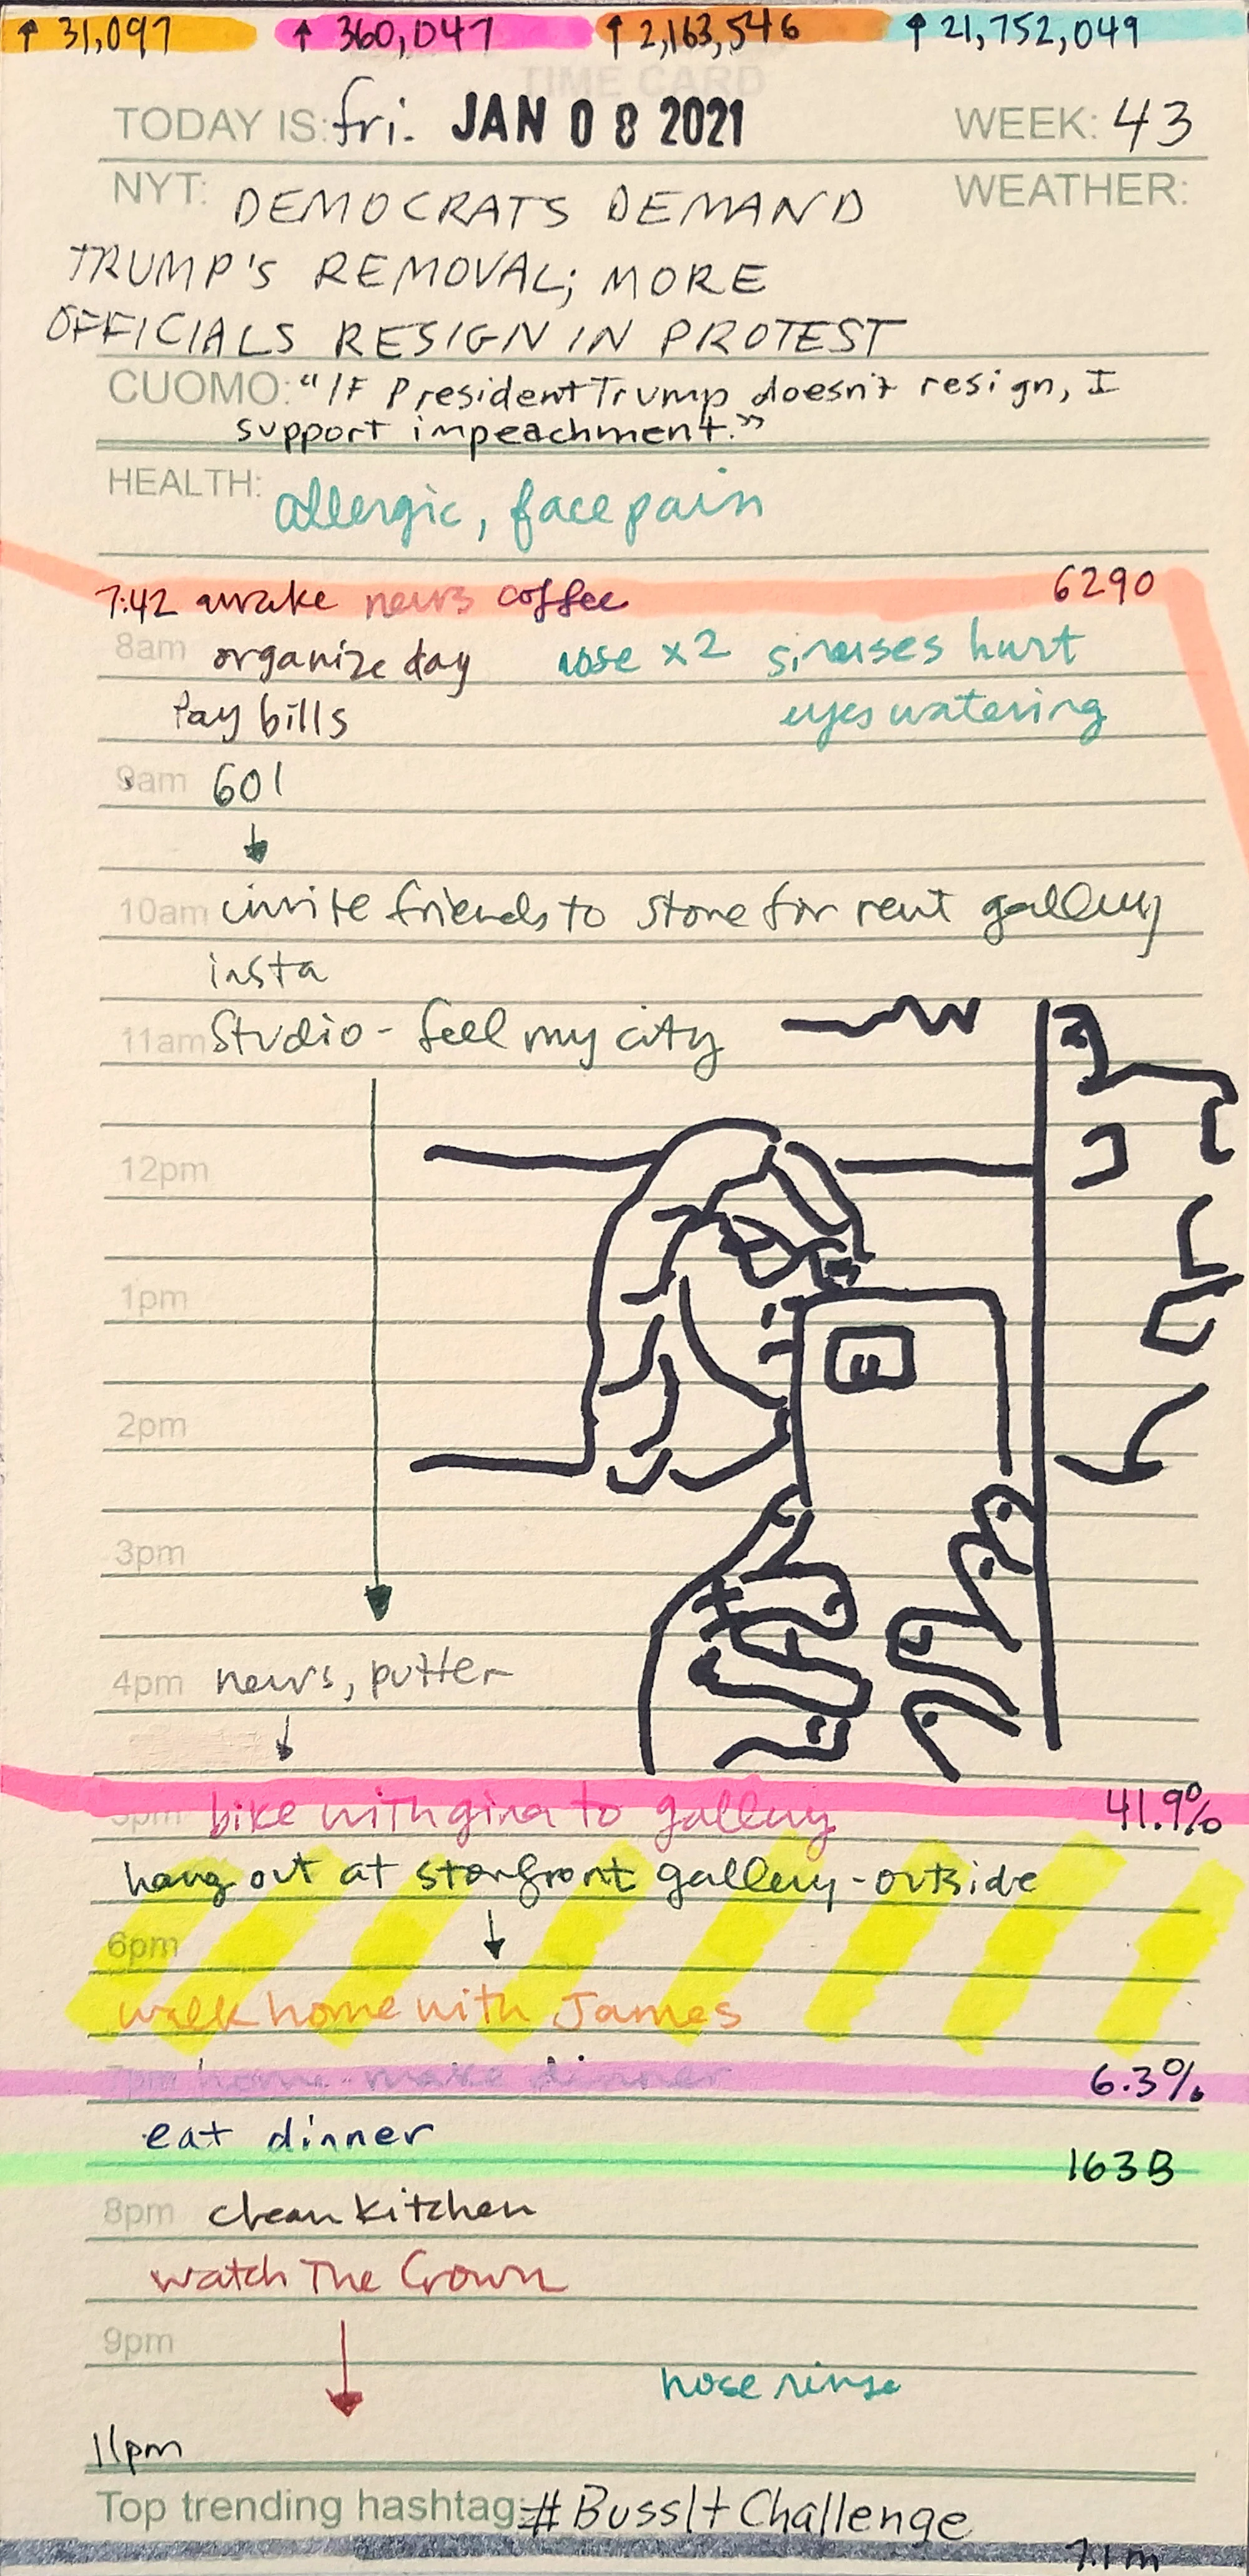
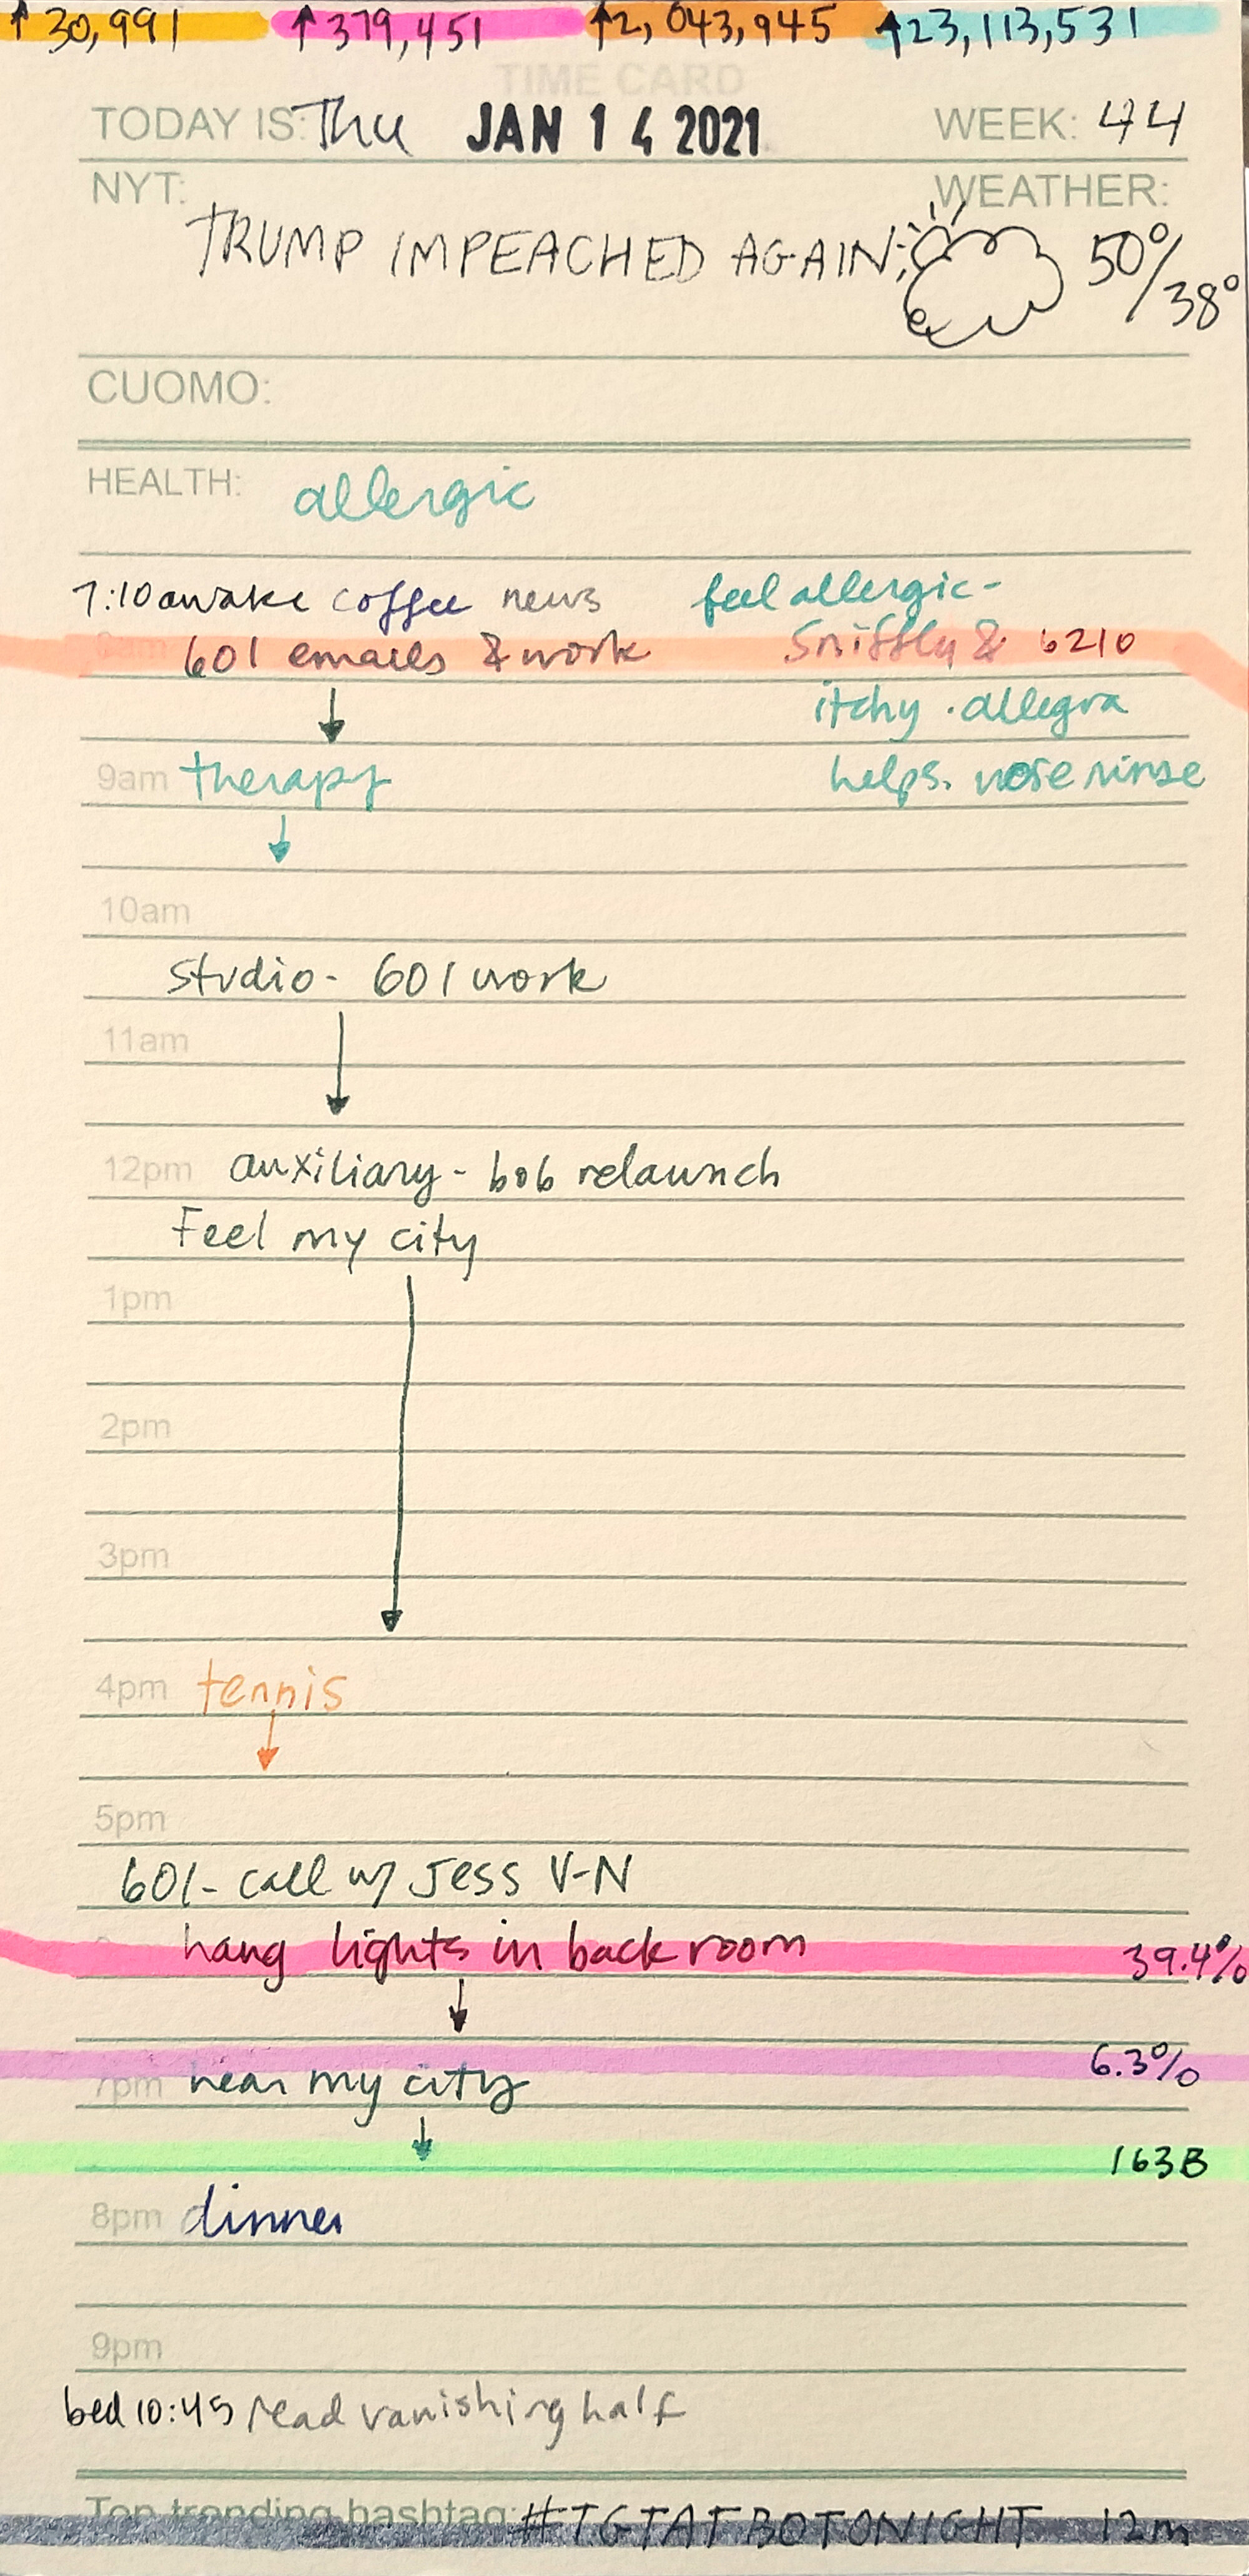
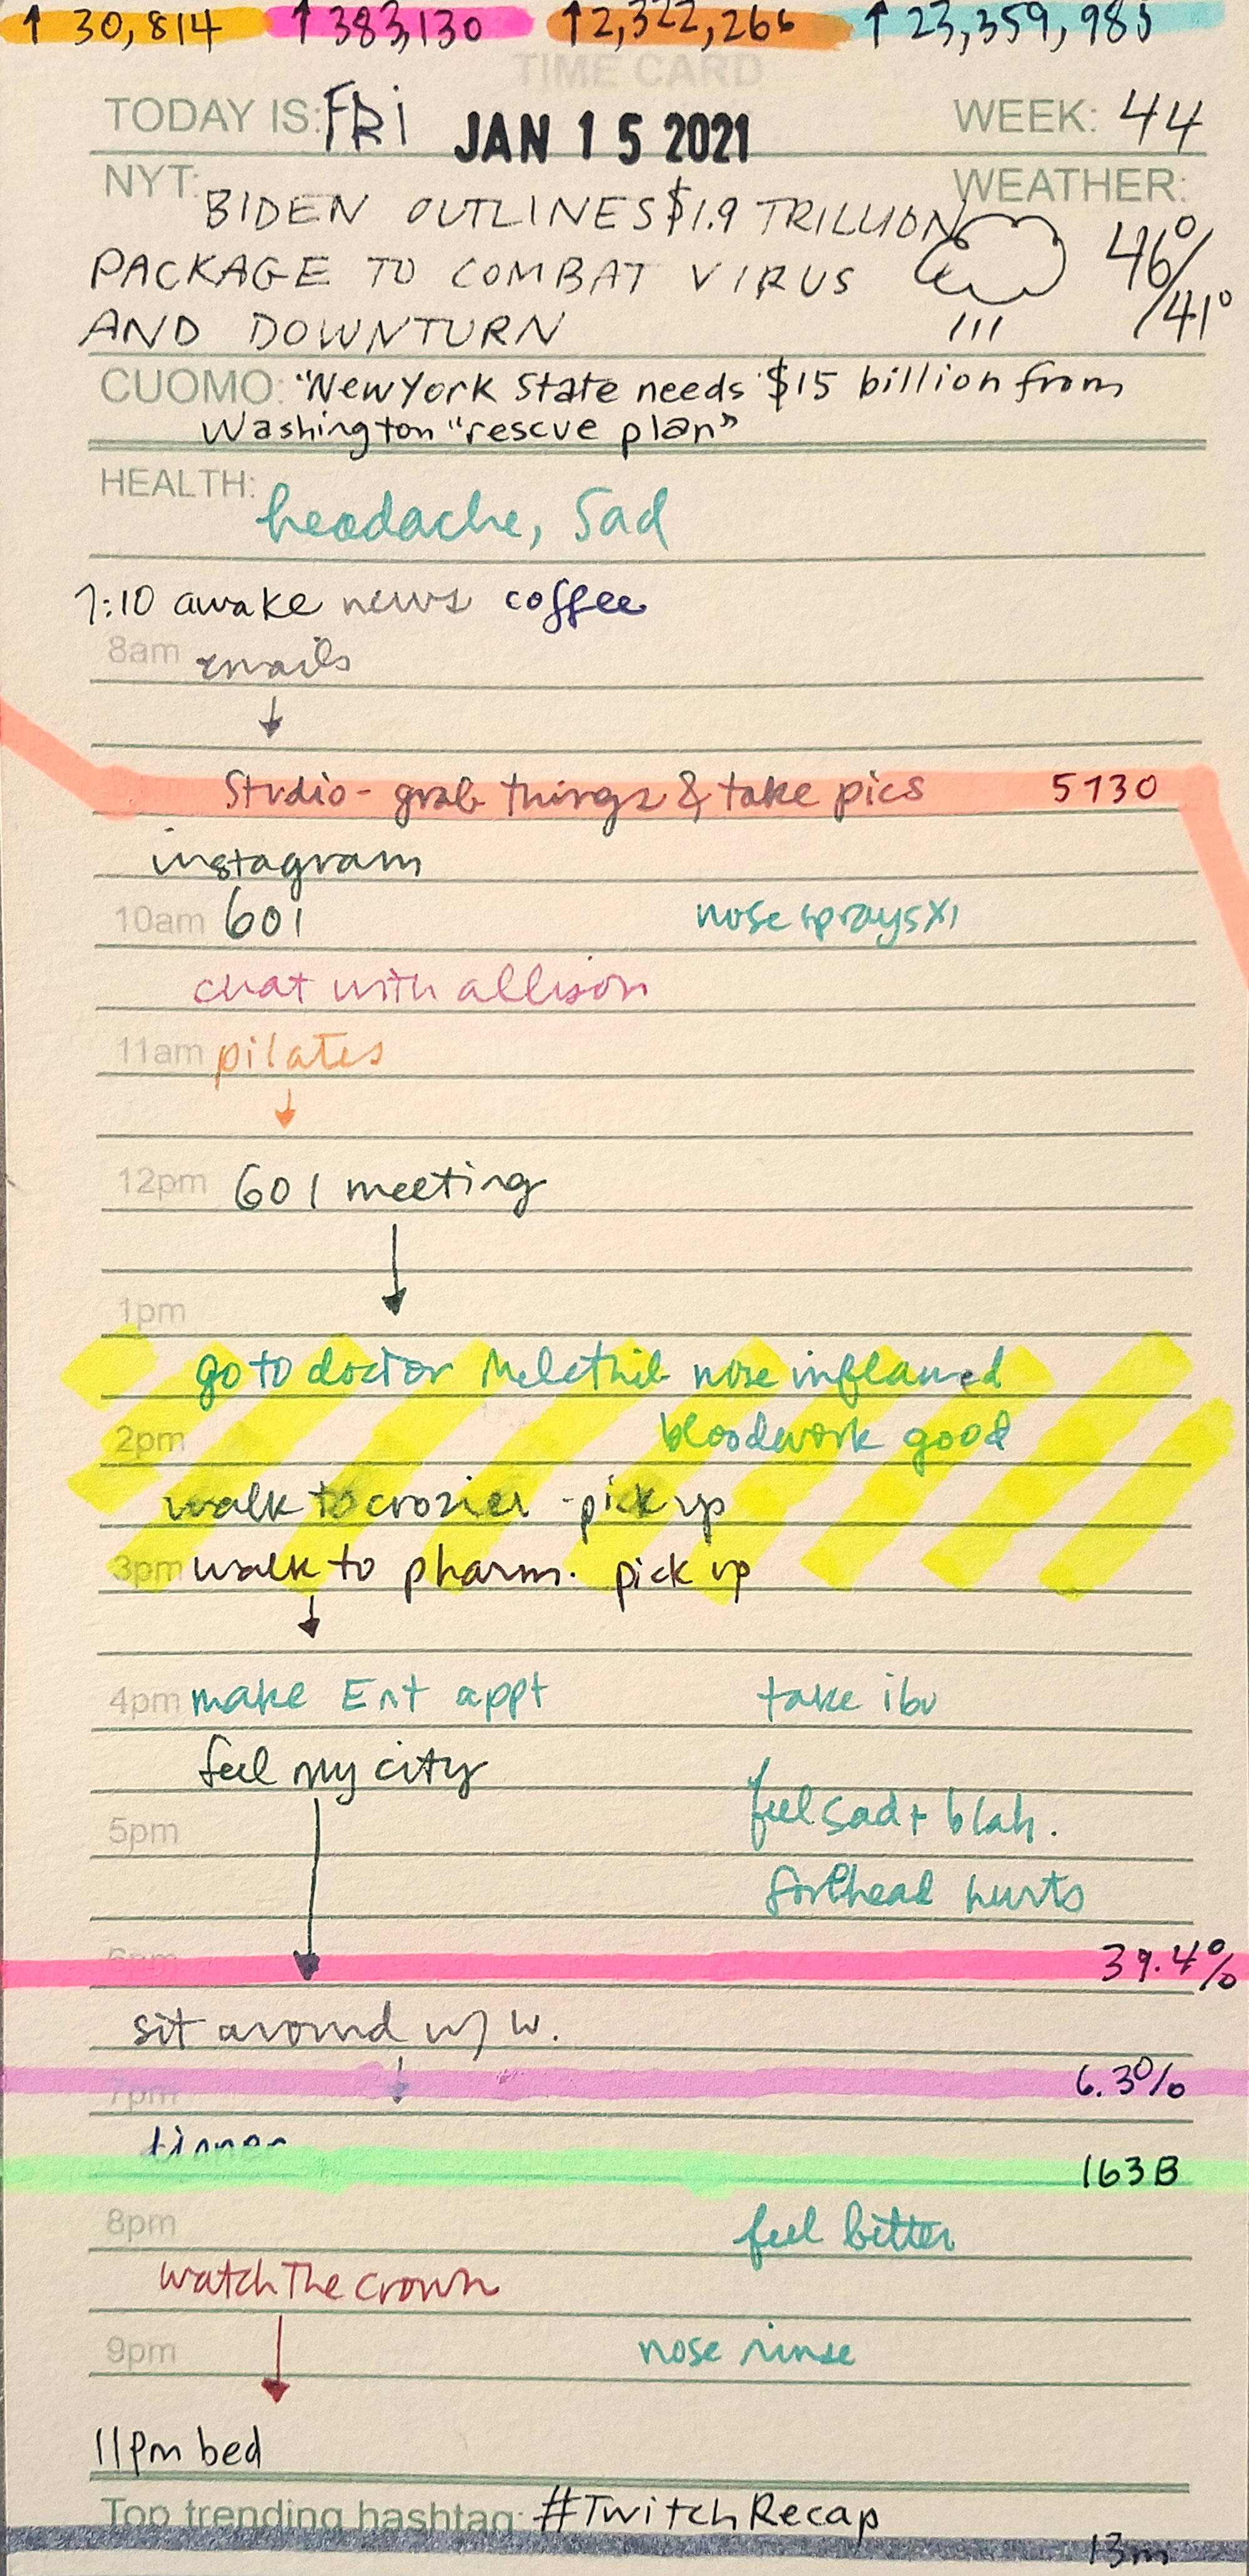
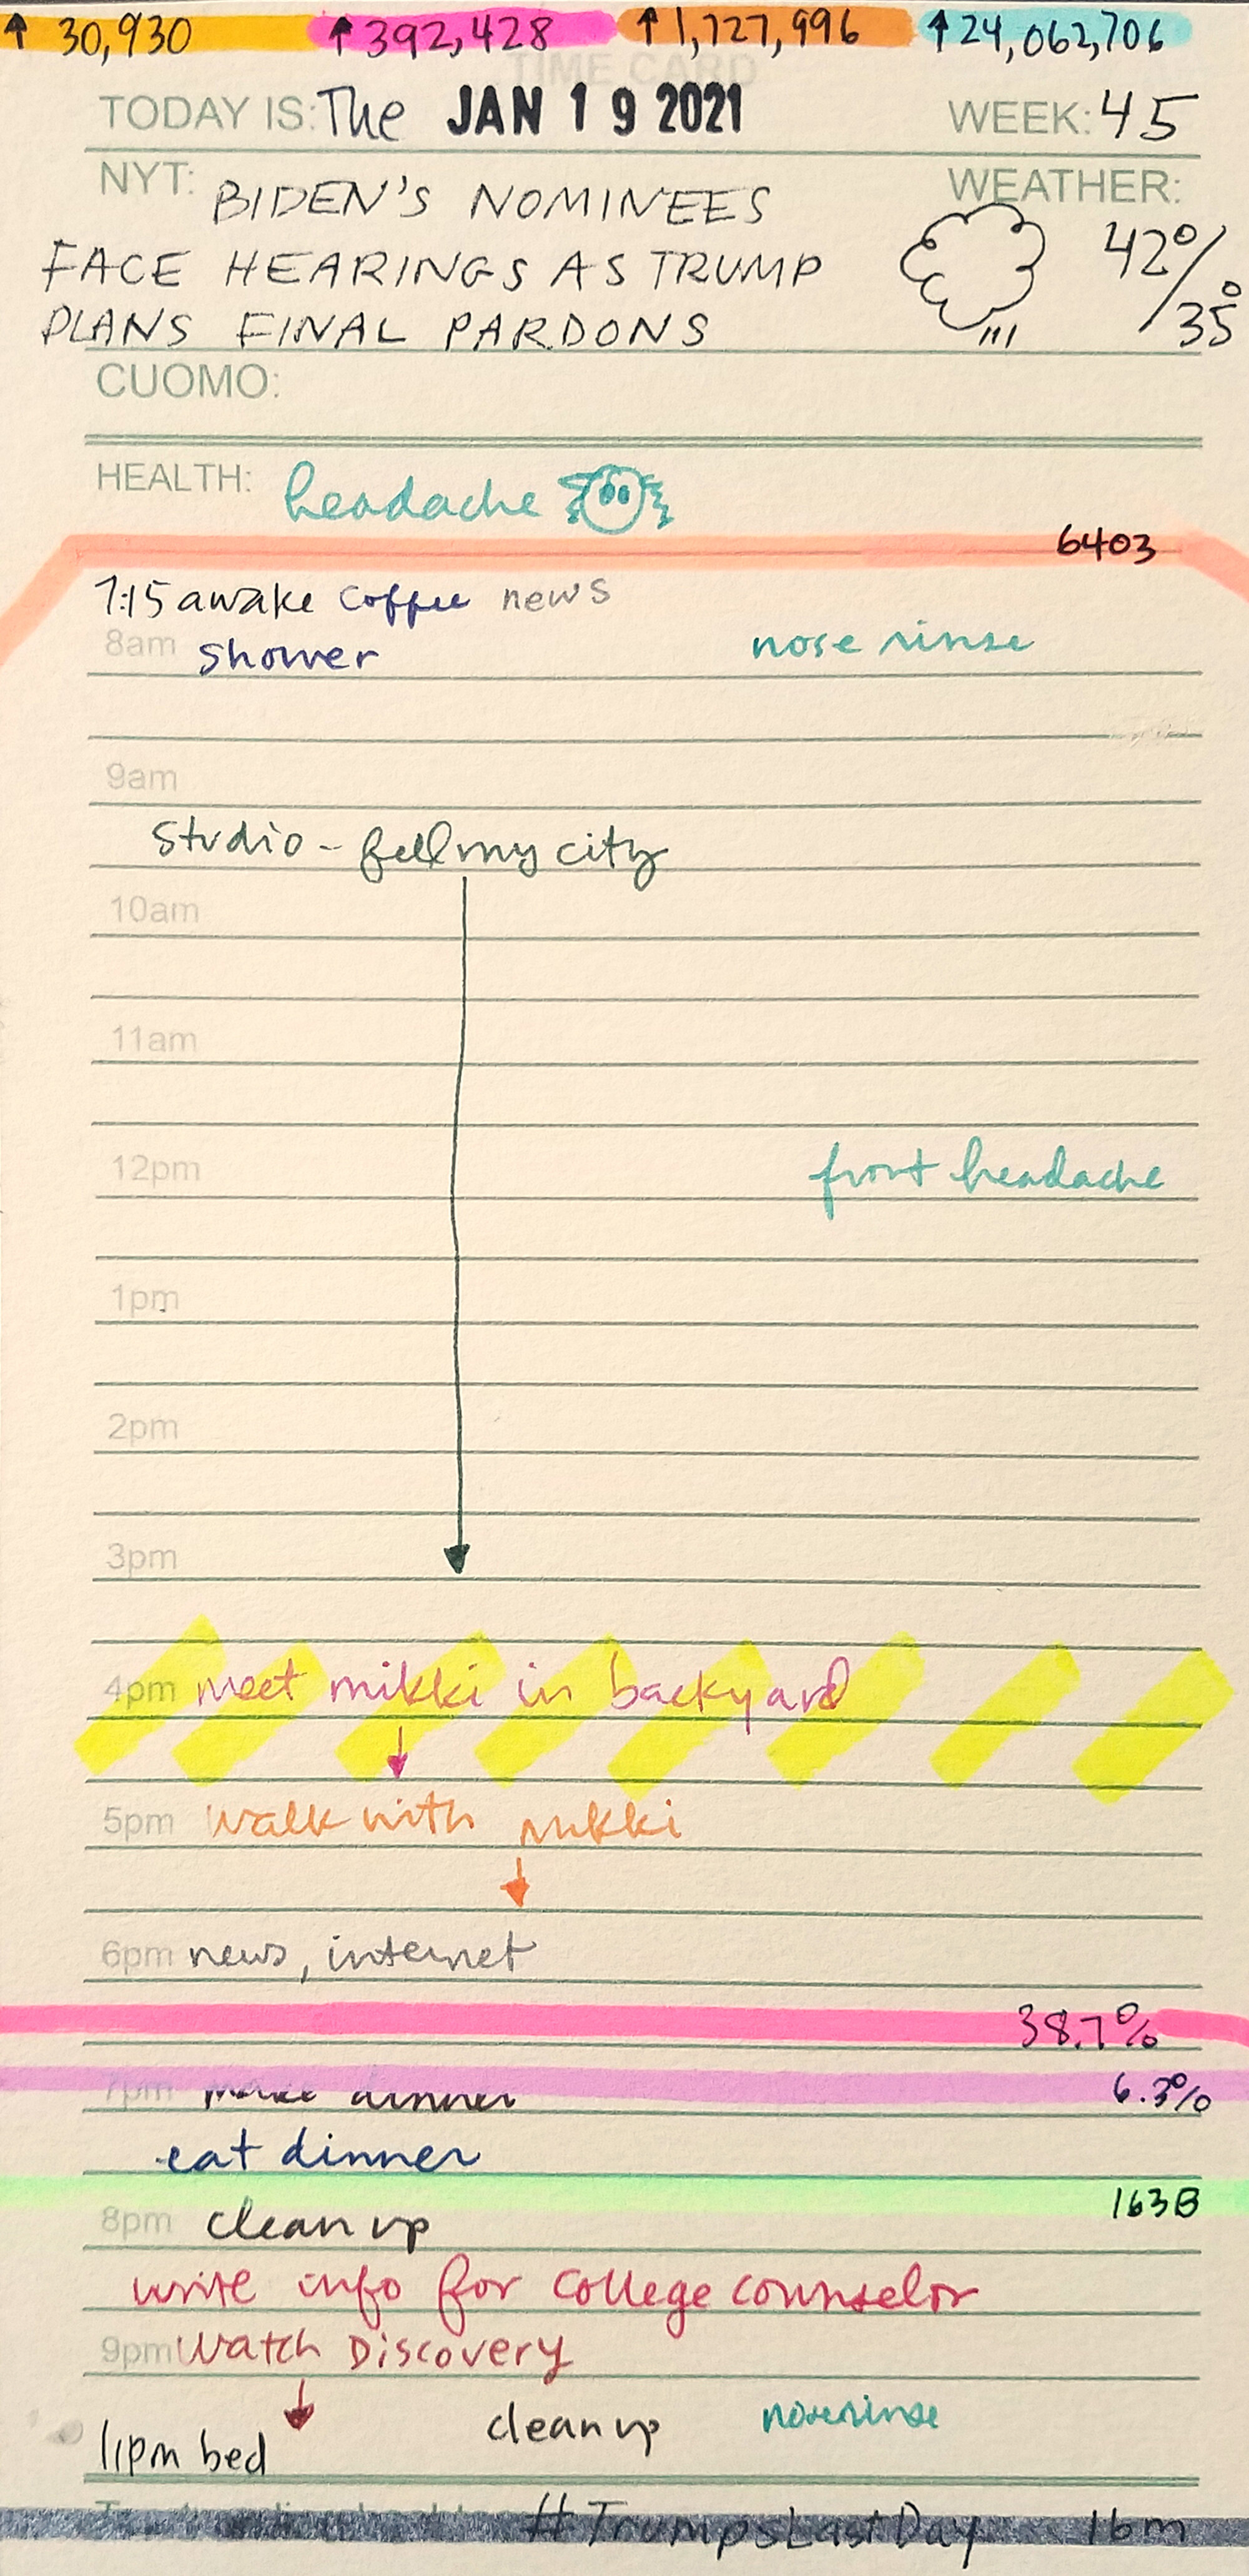
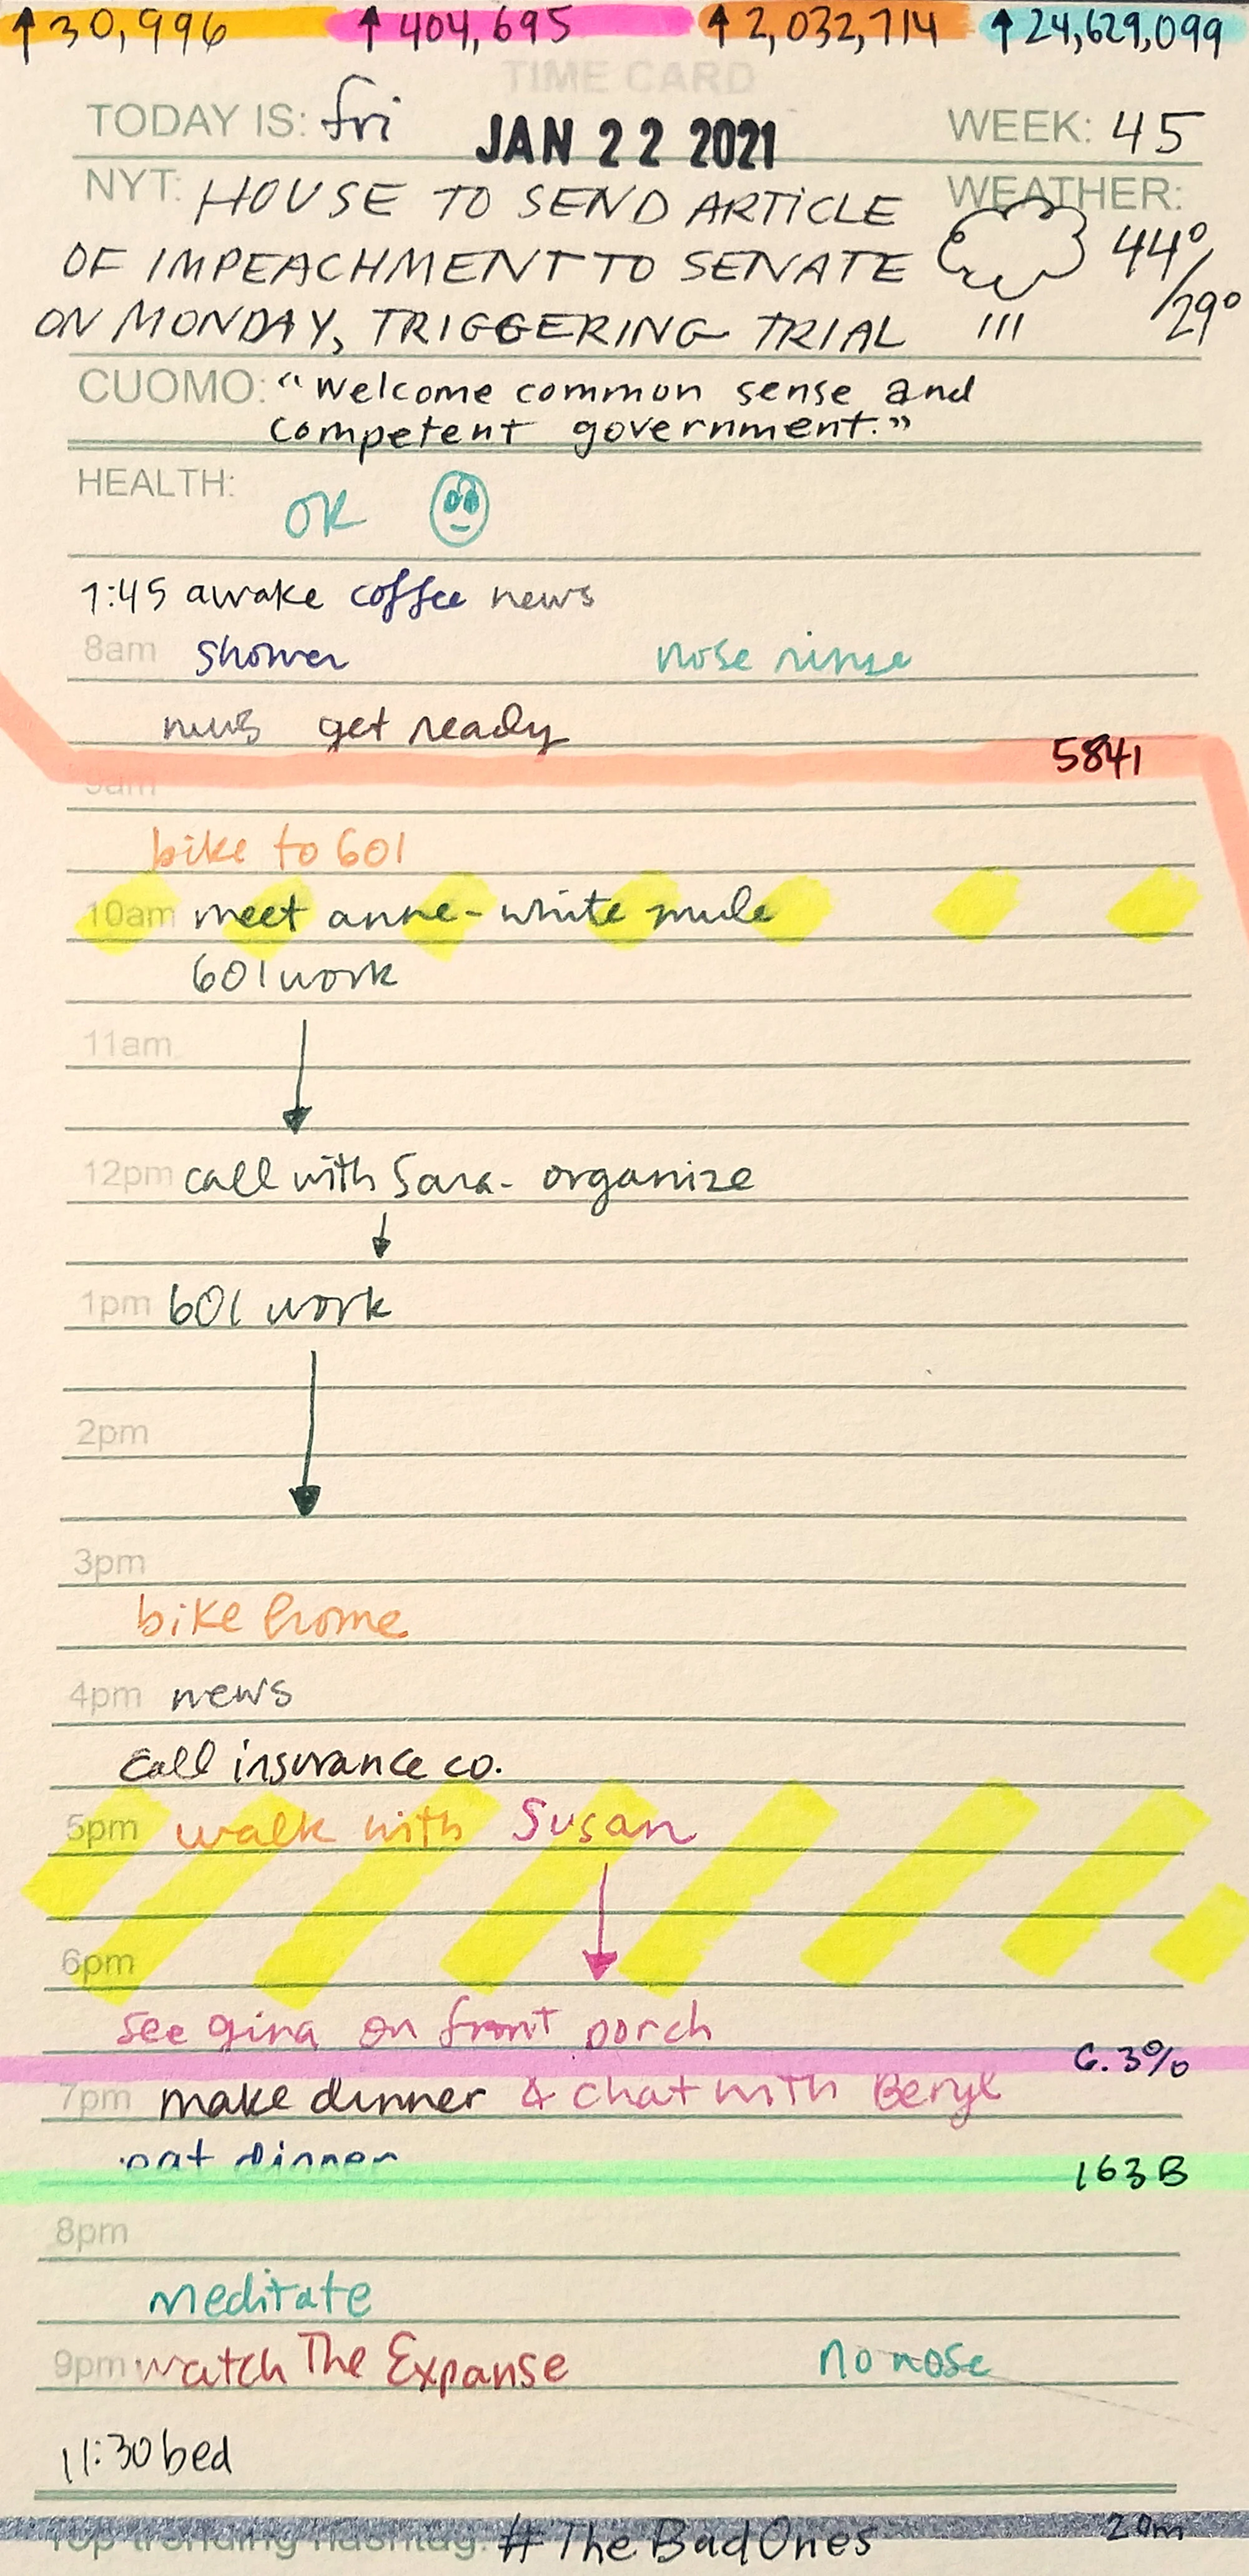
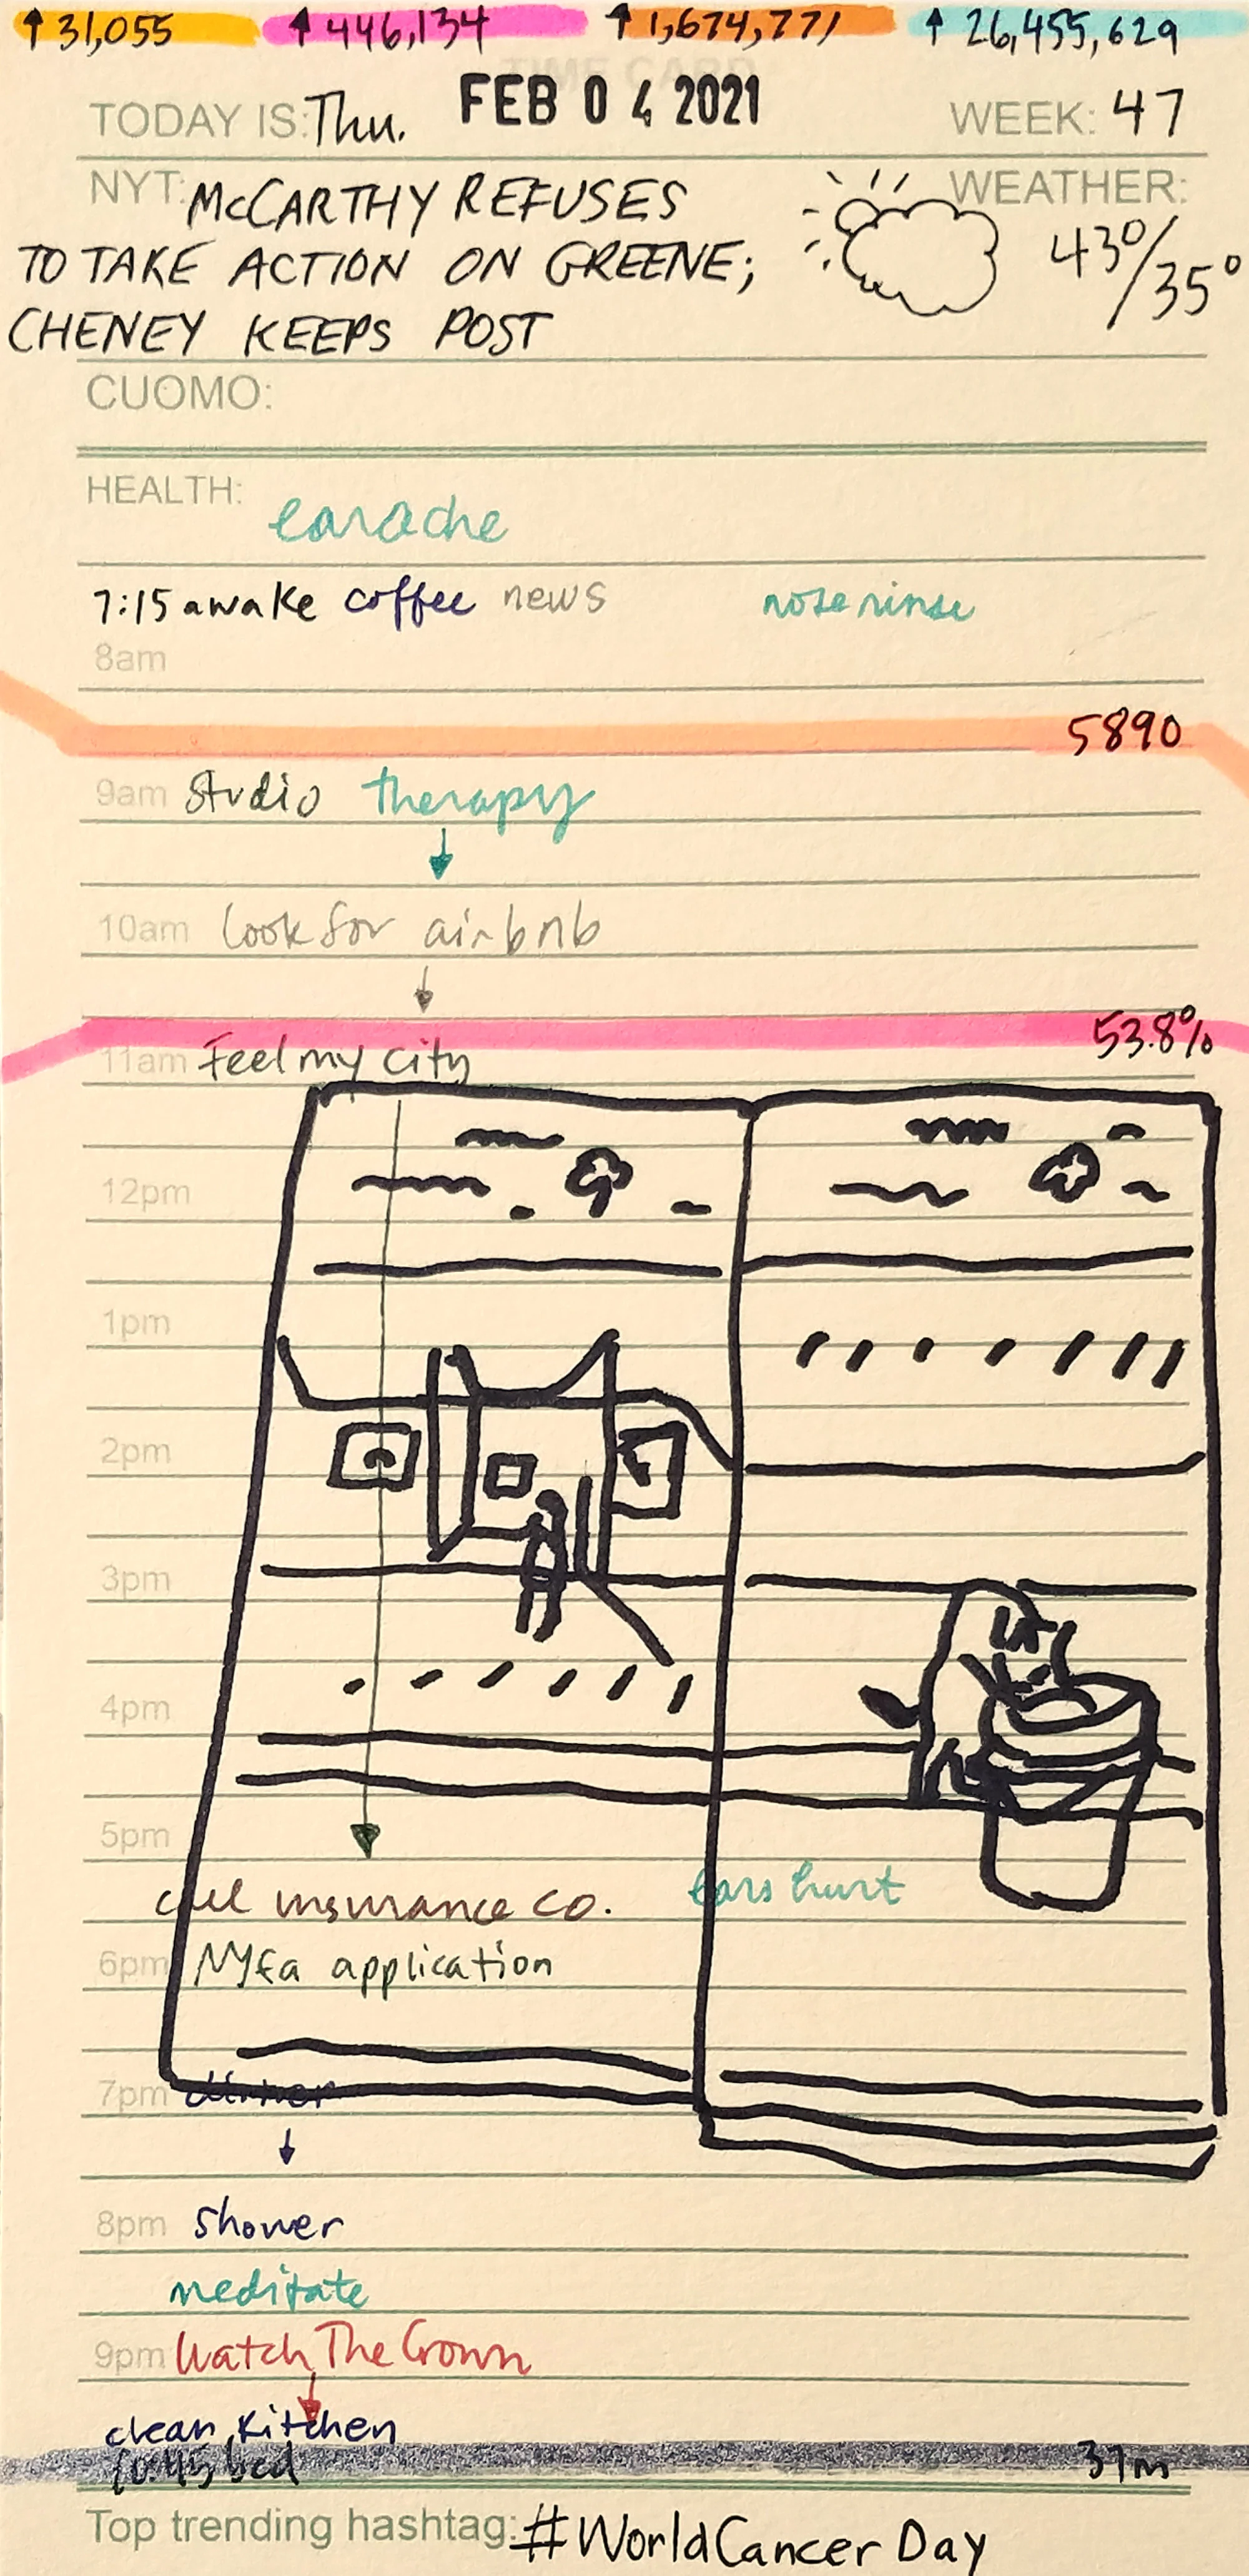
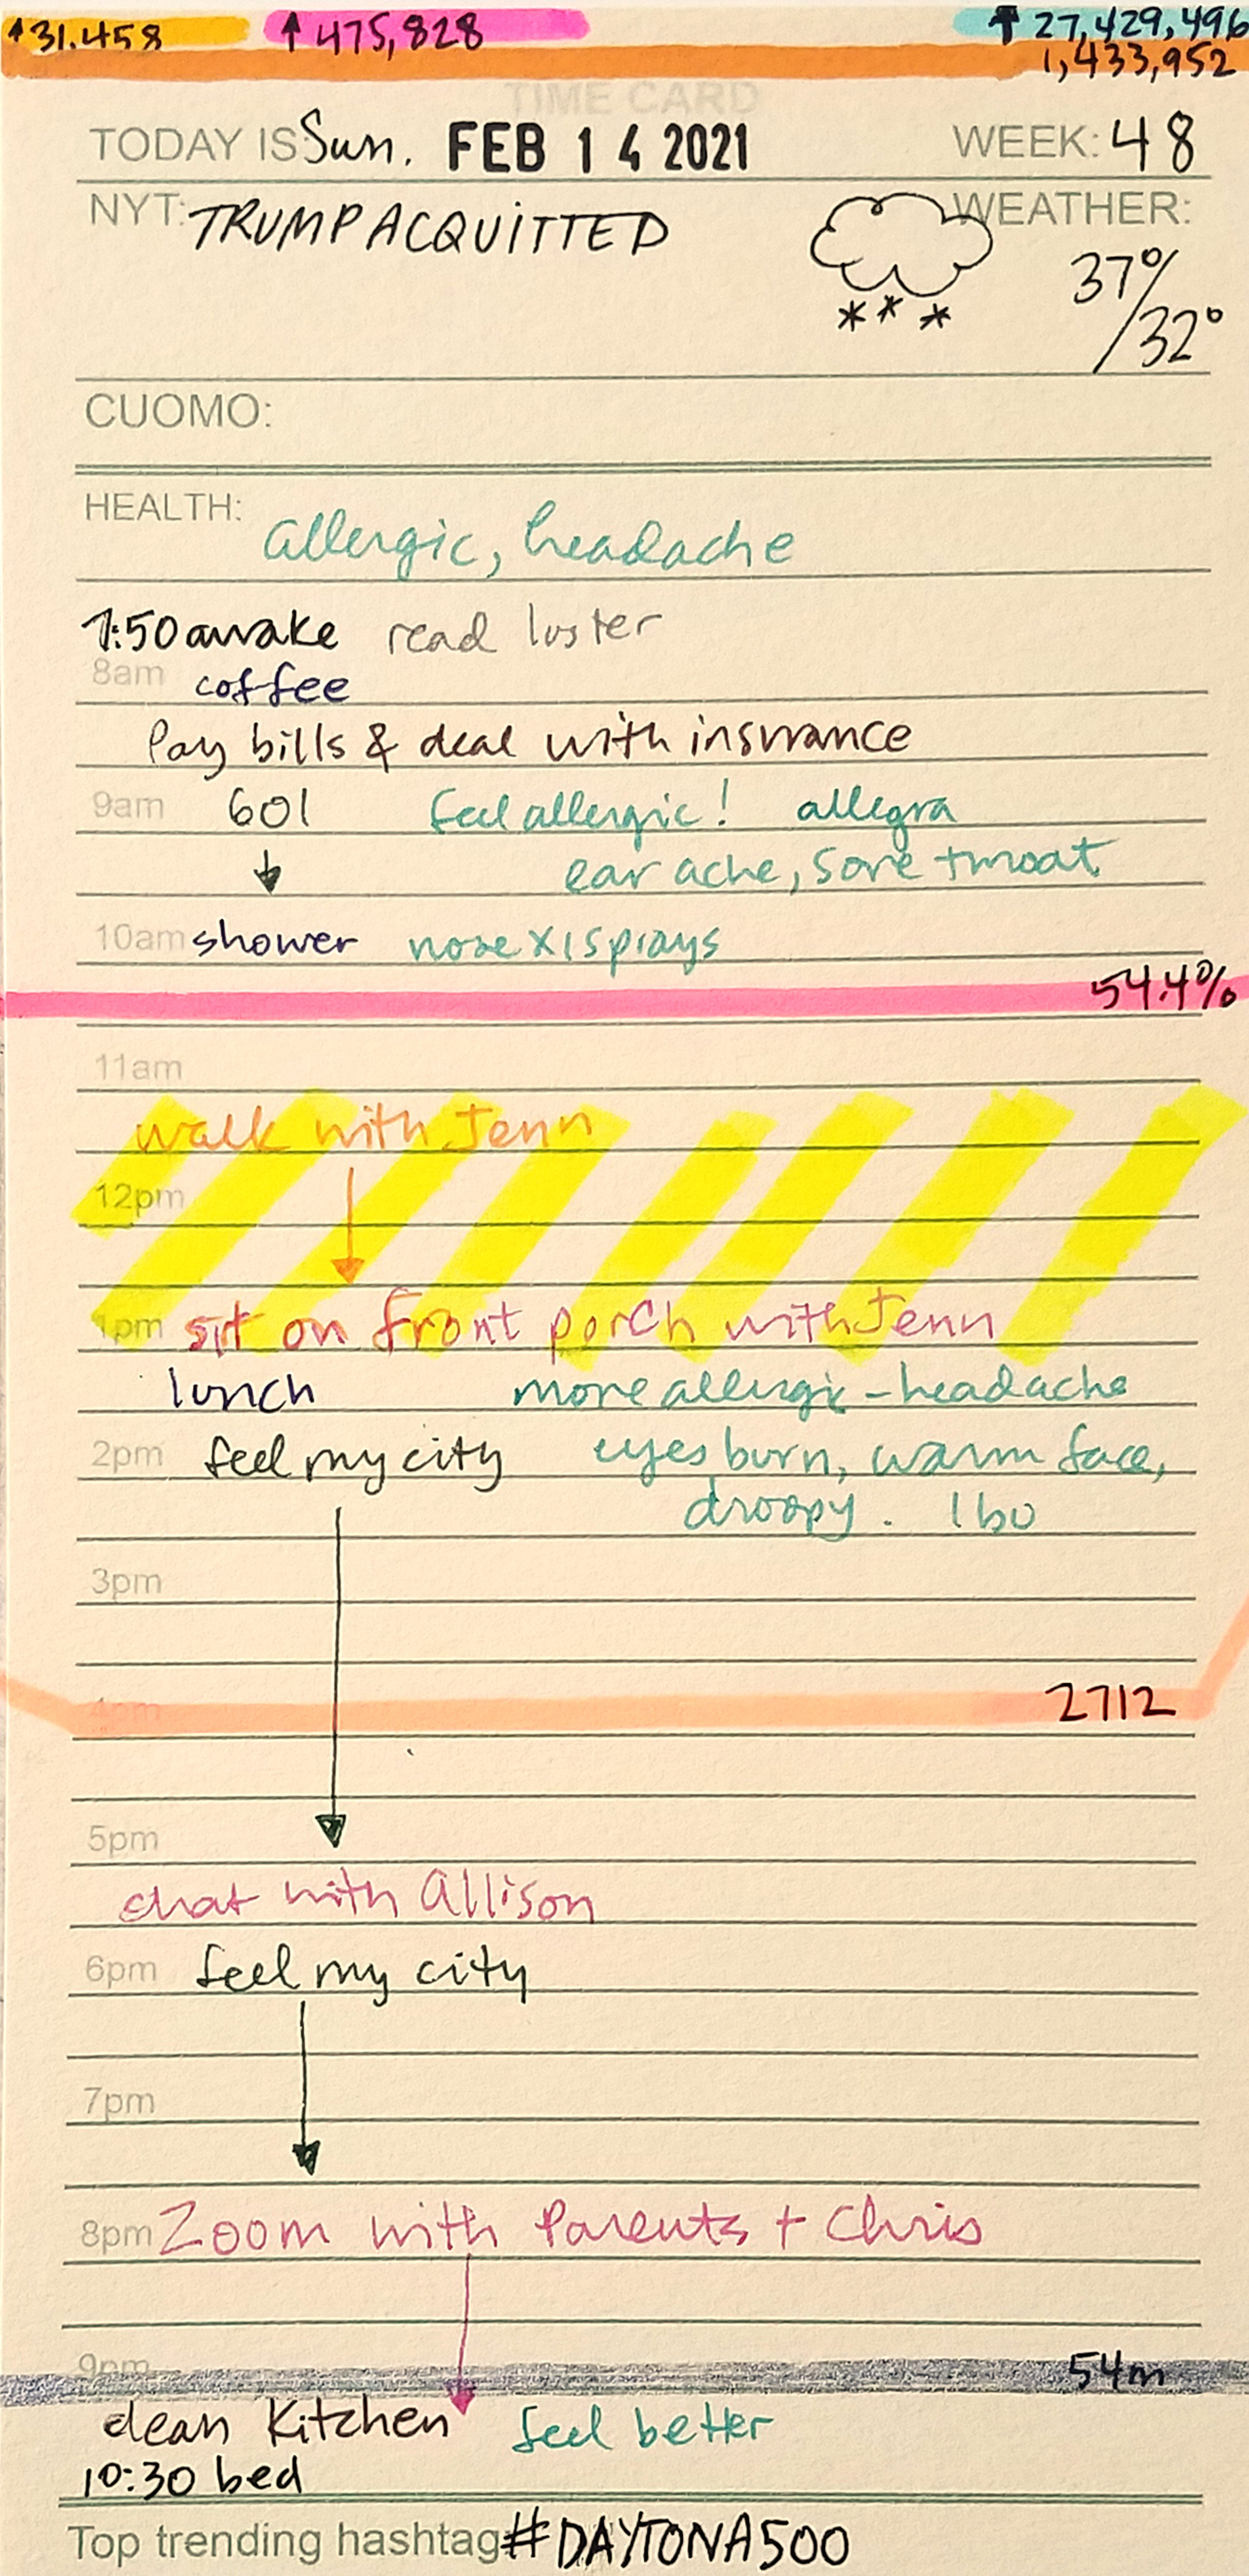
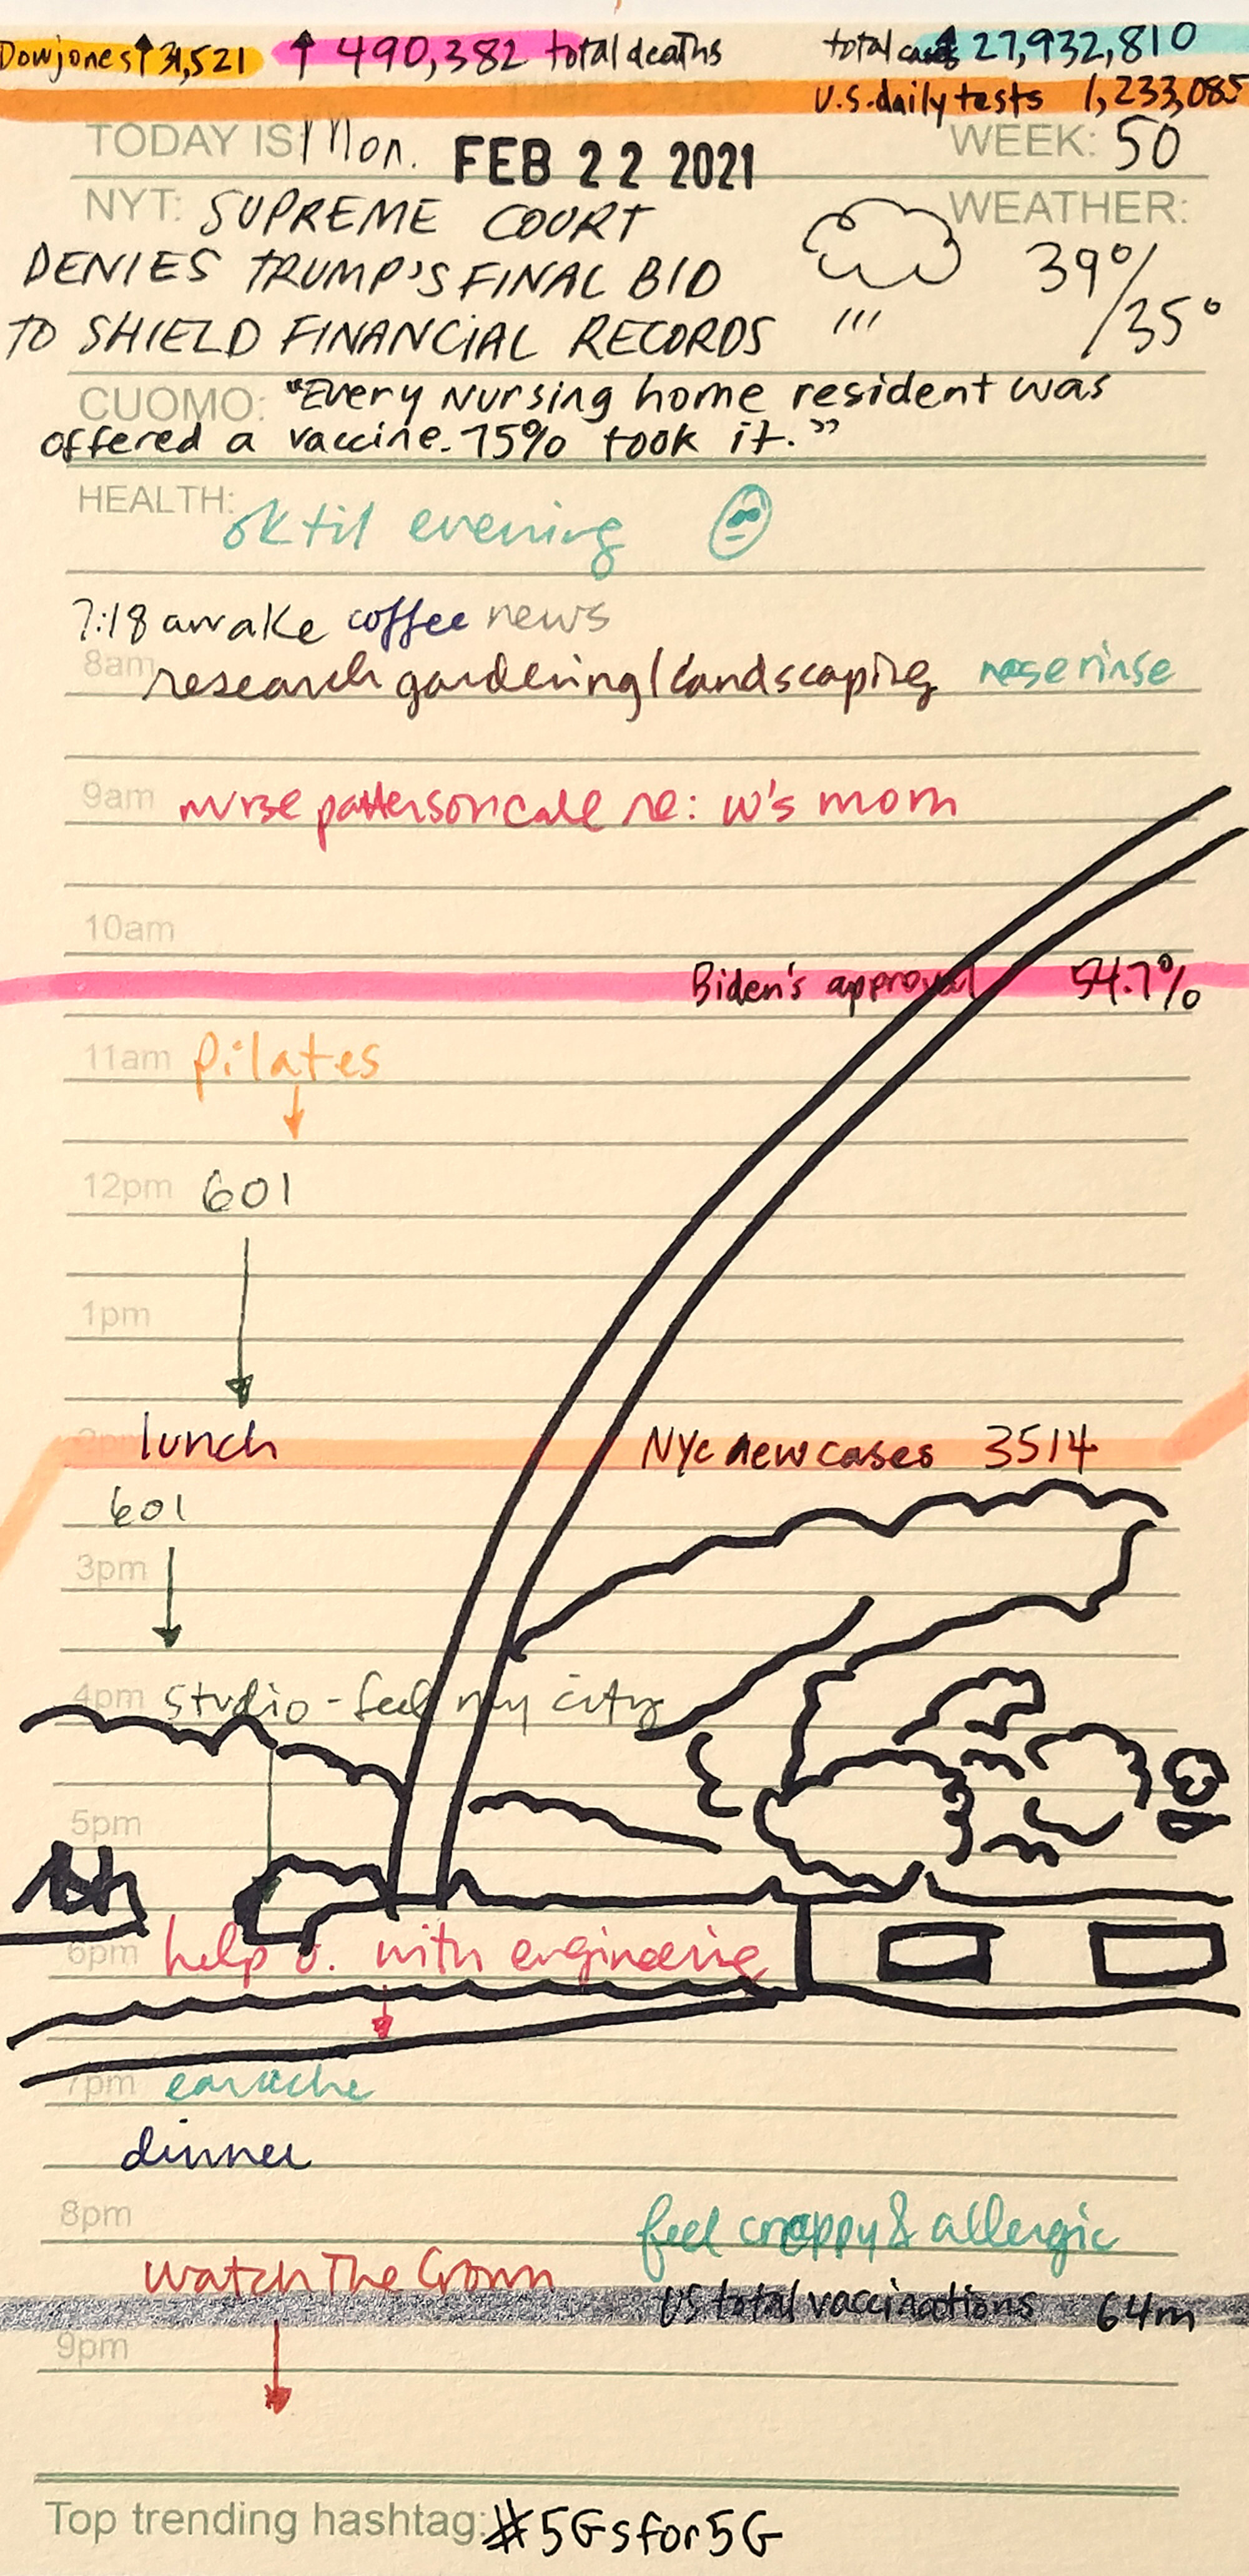
Feel My City Breaking & Everybody Shaking
Jennifer Dalton

acrylic and ink on paper, 8 1/4 inches x 125 feet fully extended
Part 1: March 1, 2020 - June 30, 2020


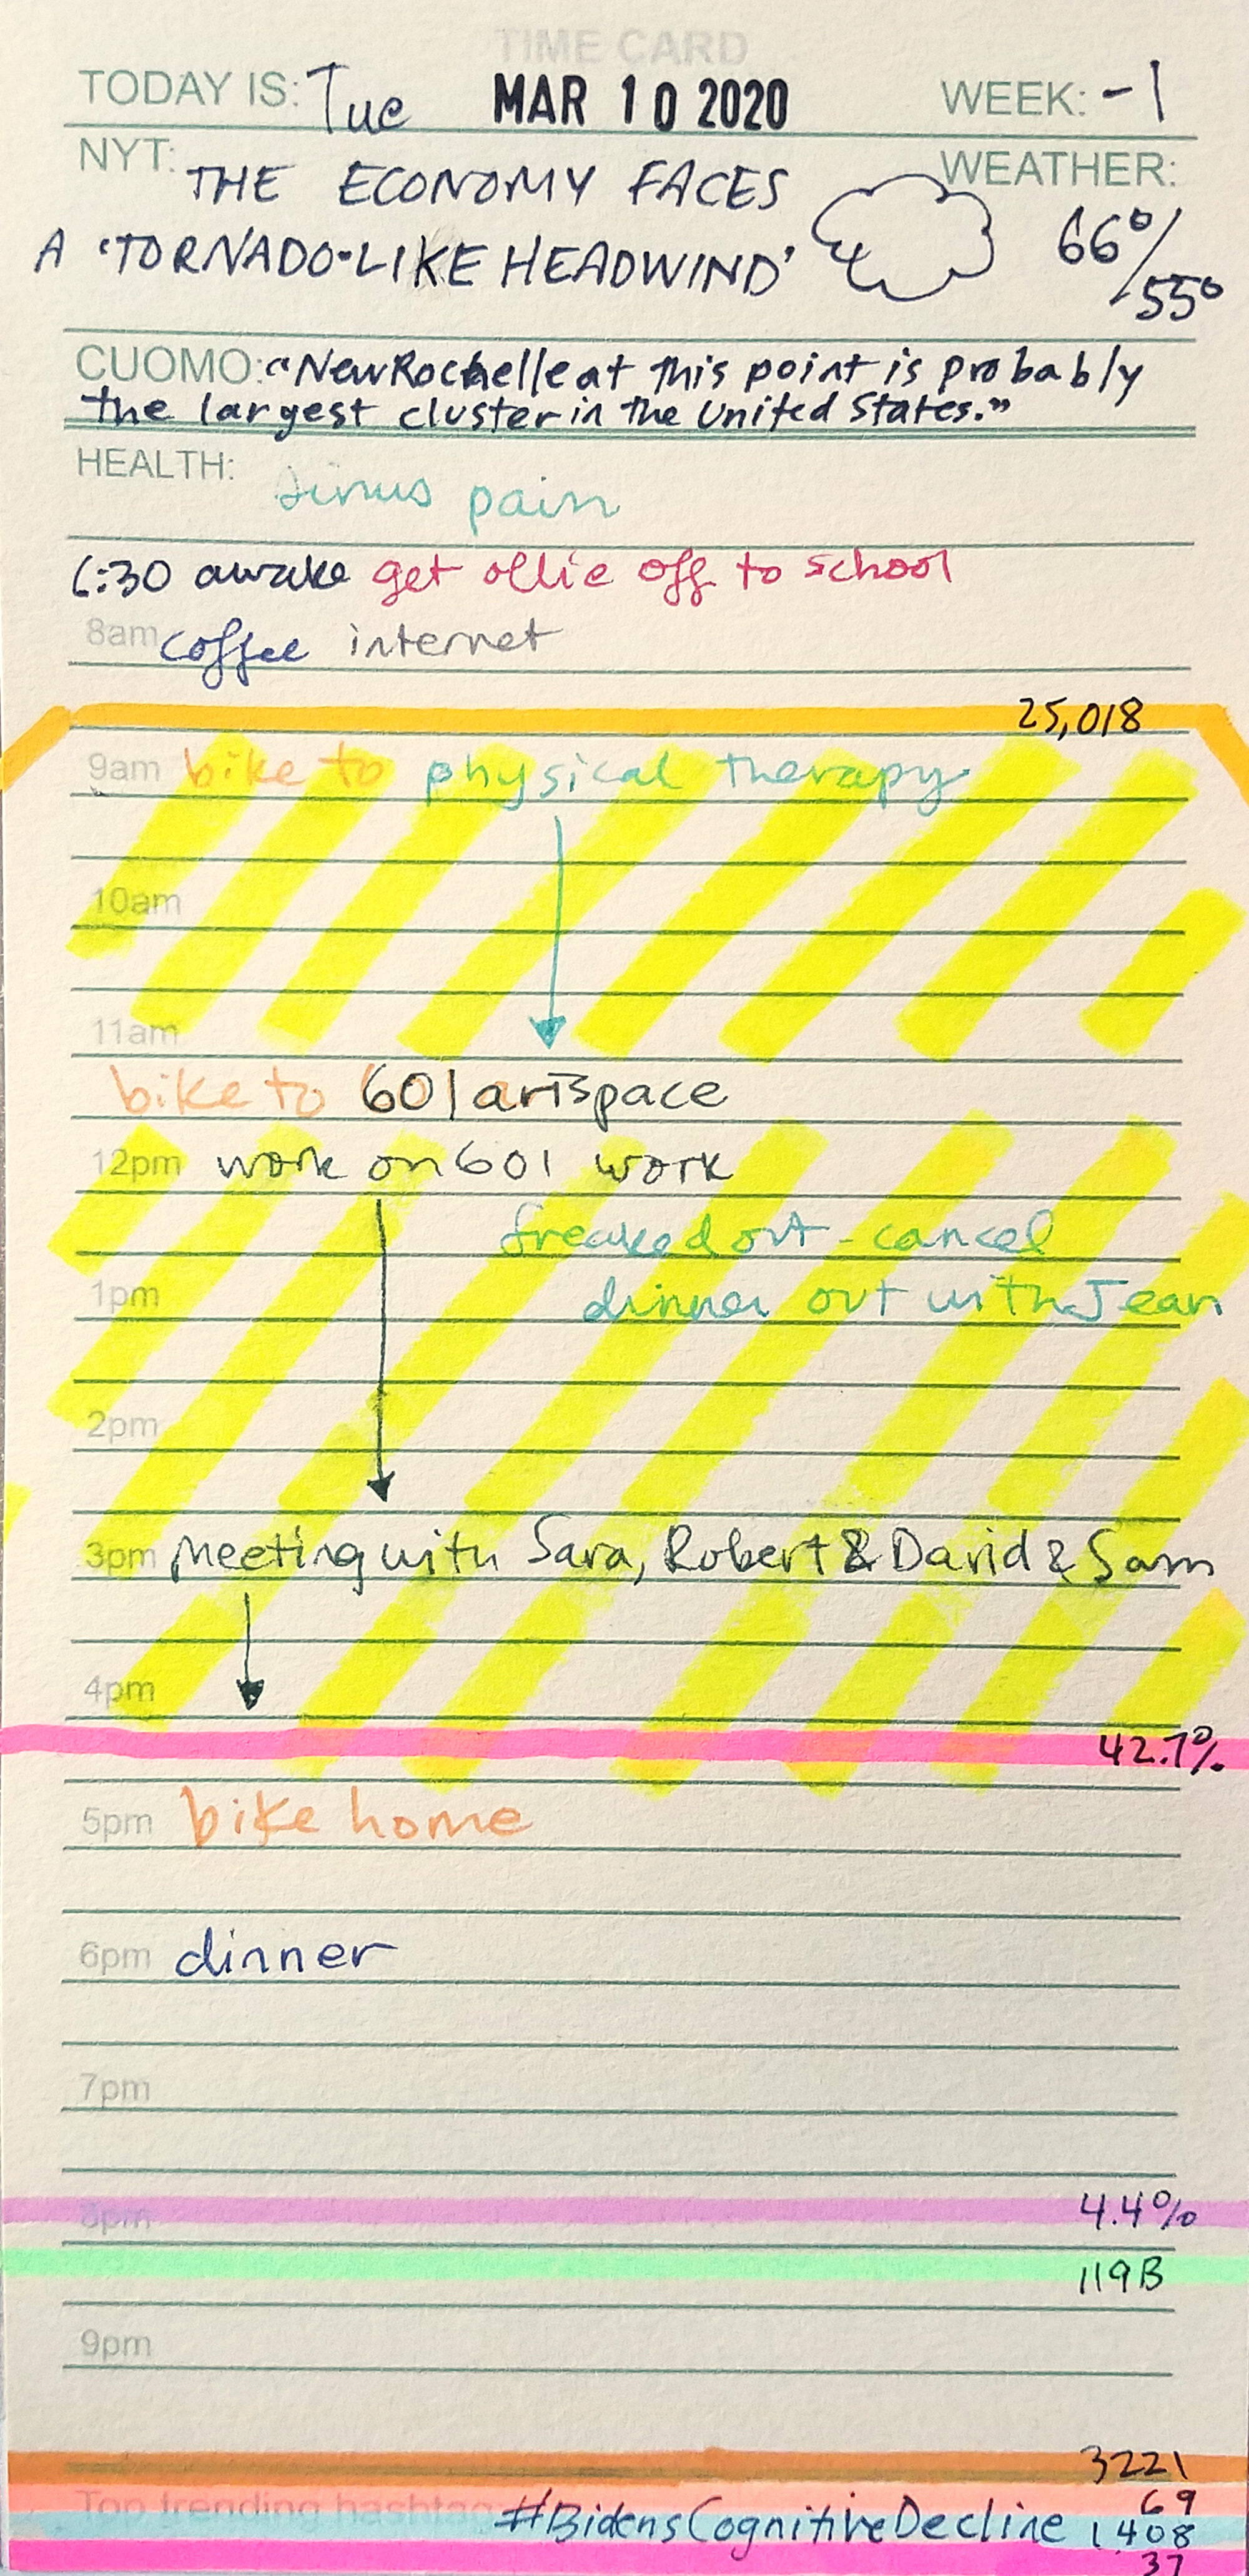


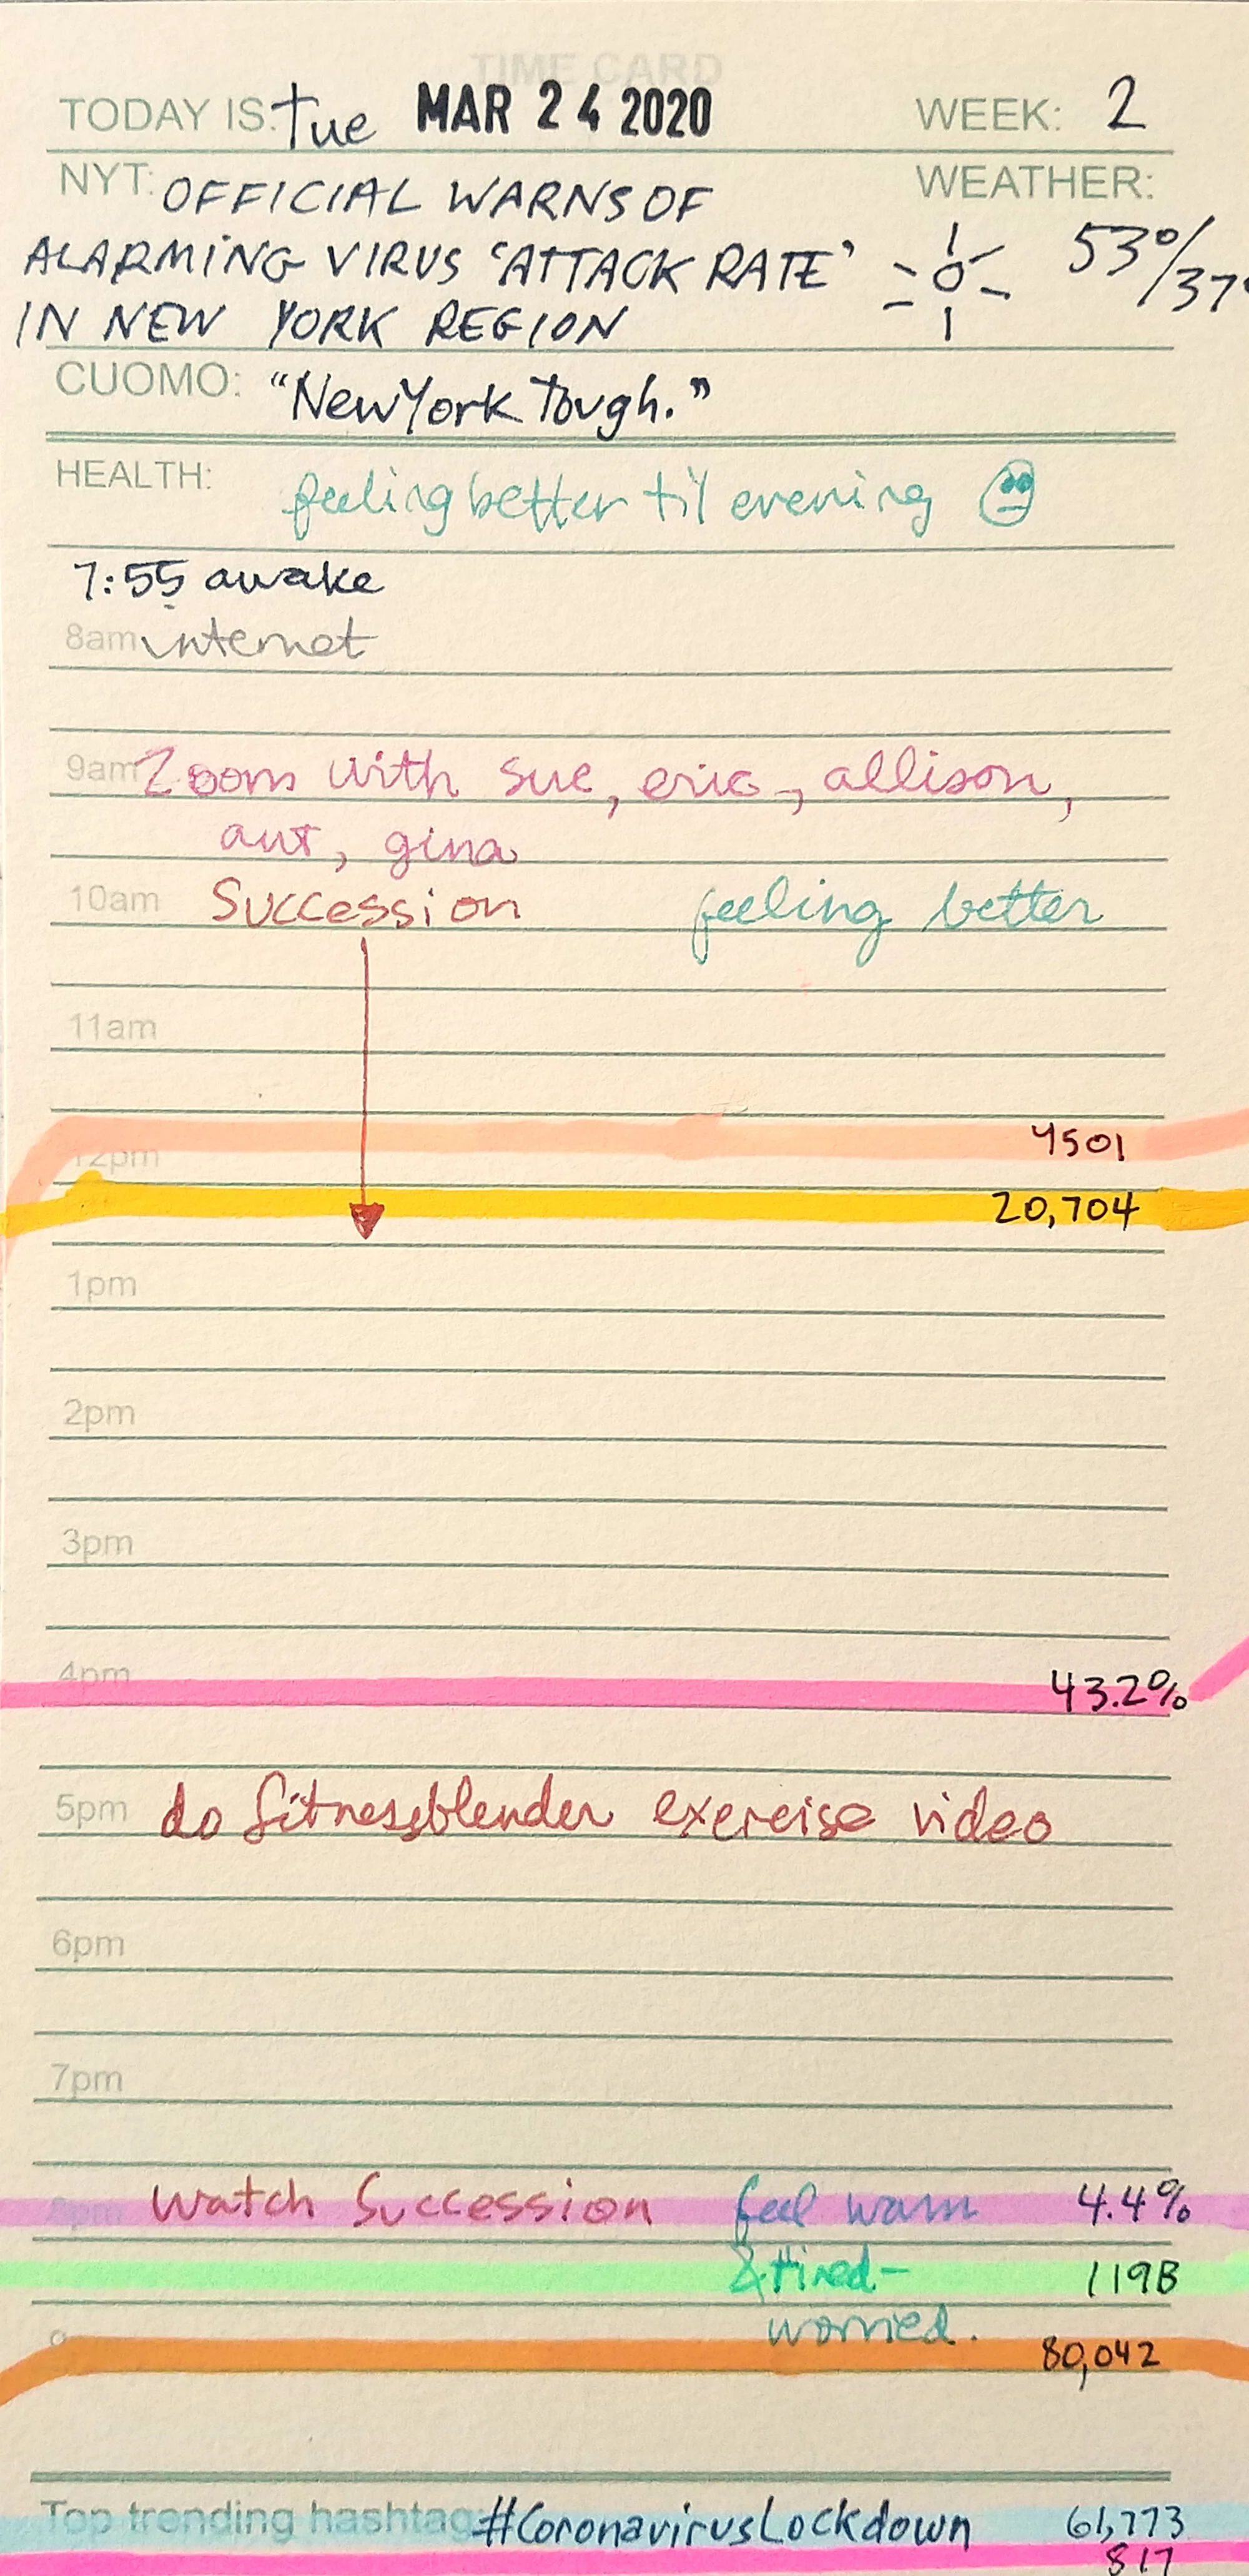

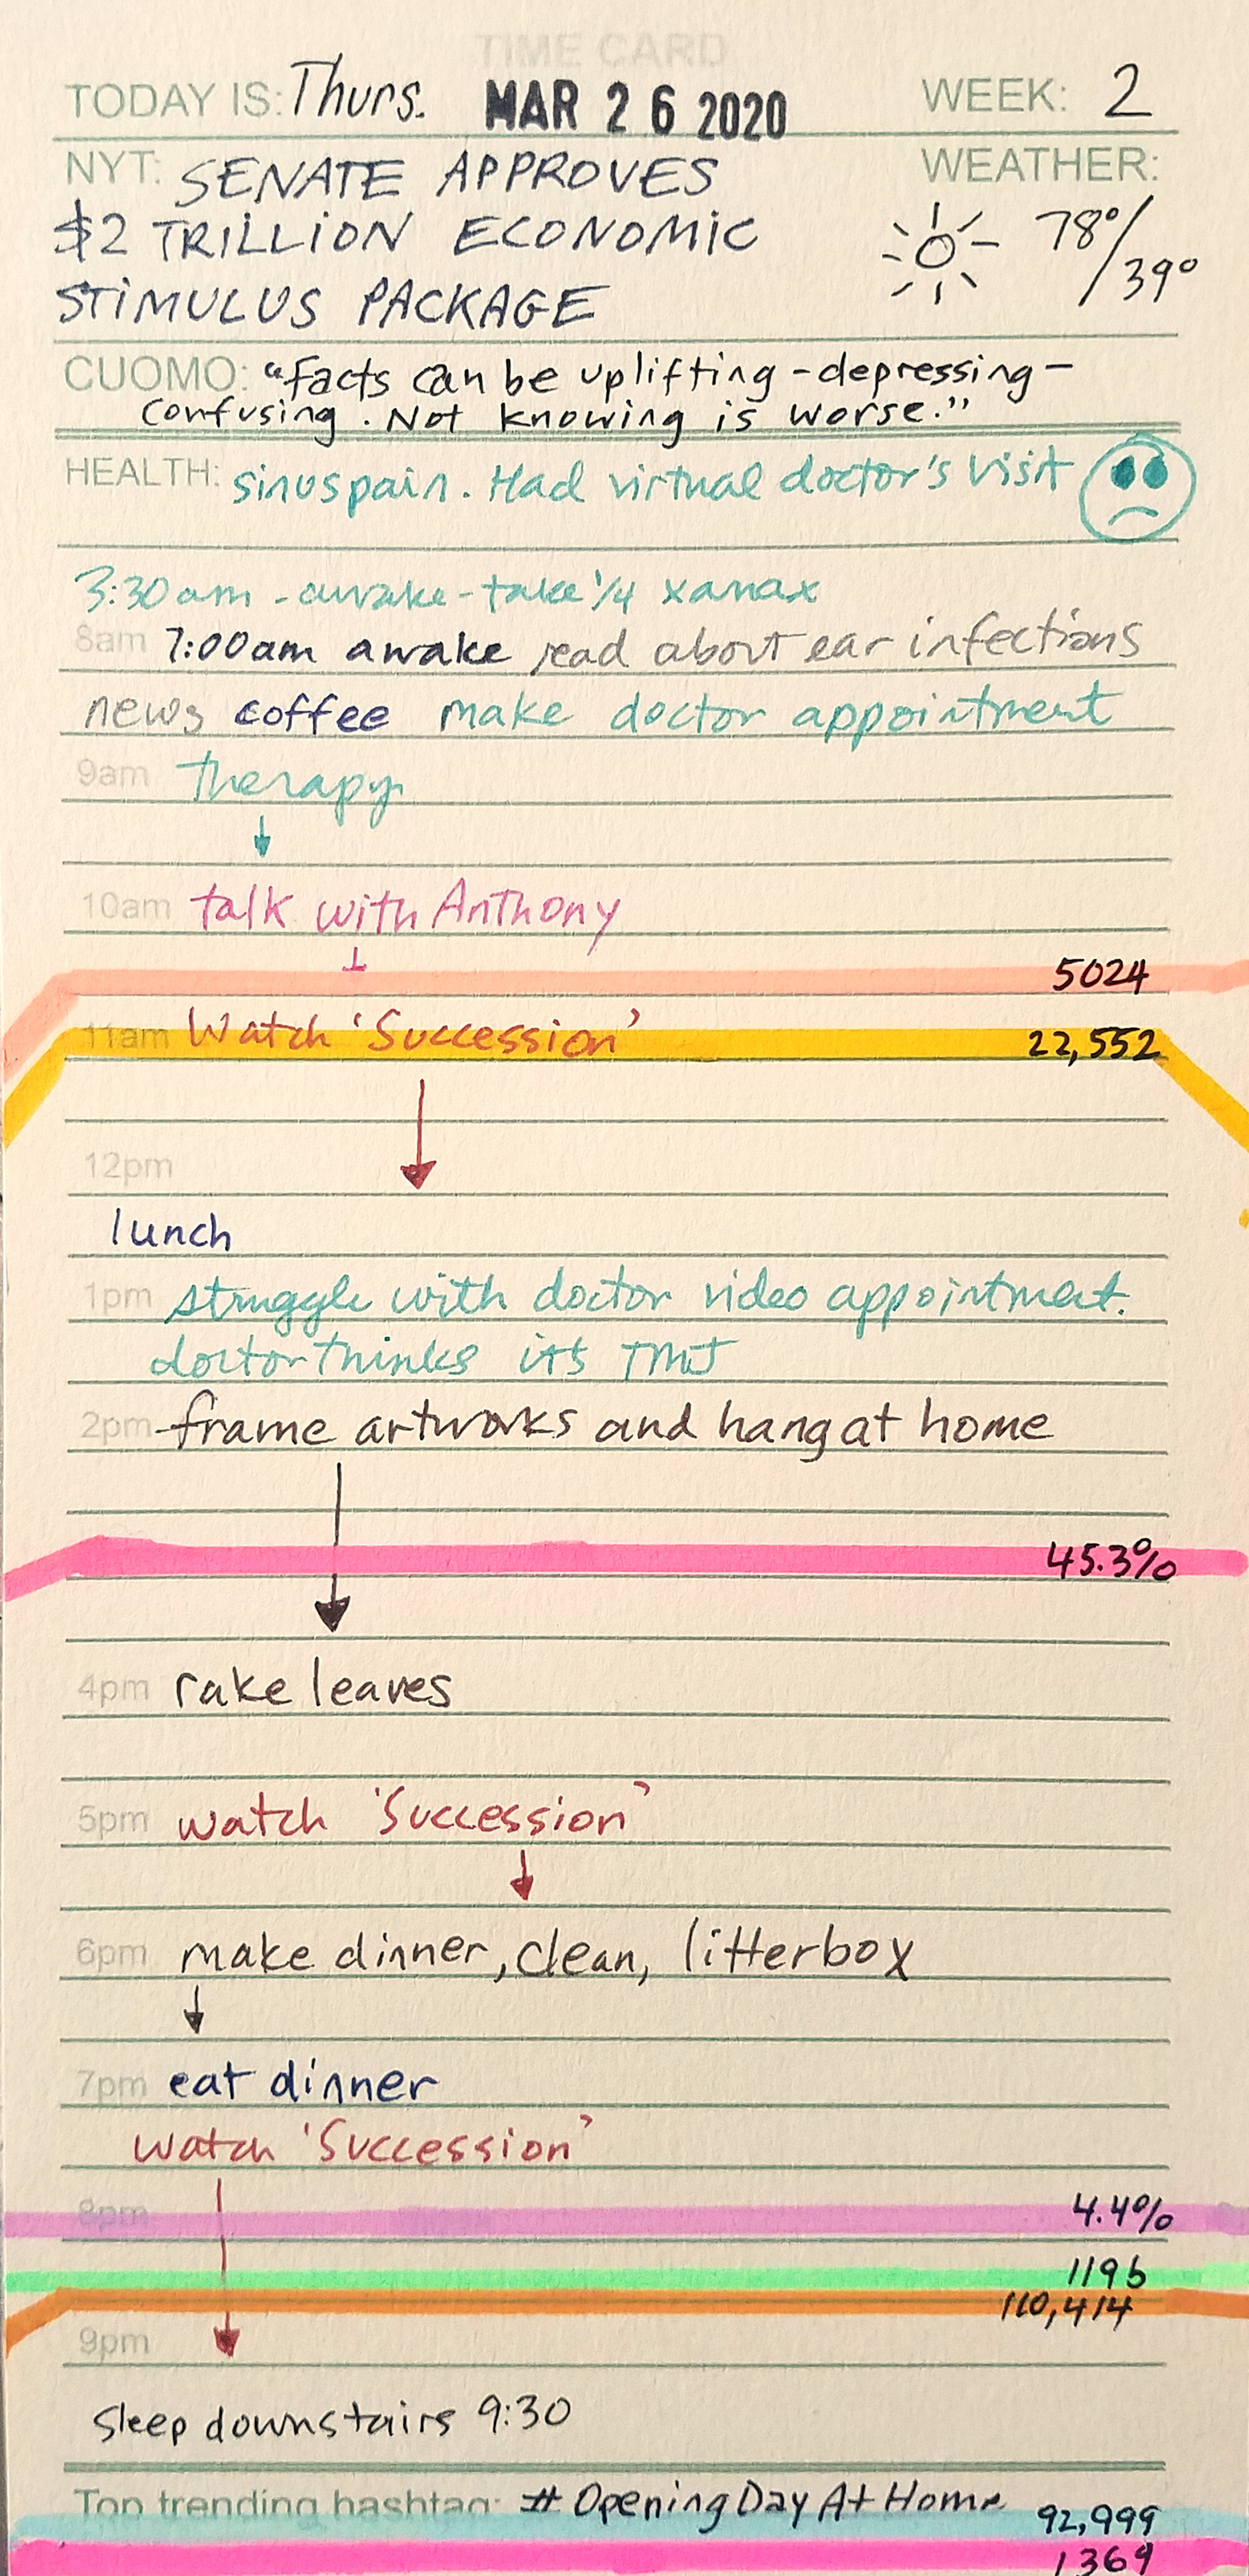


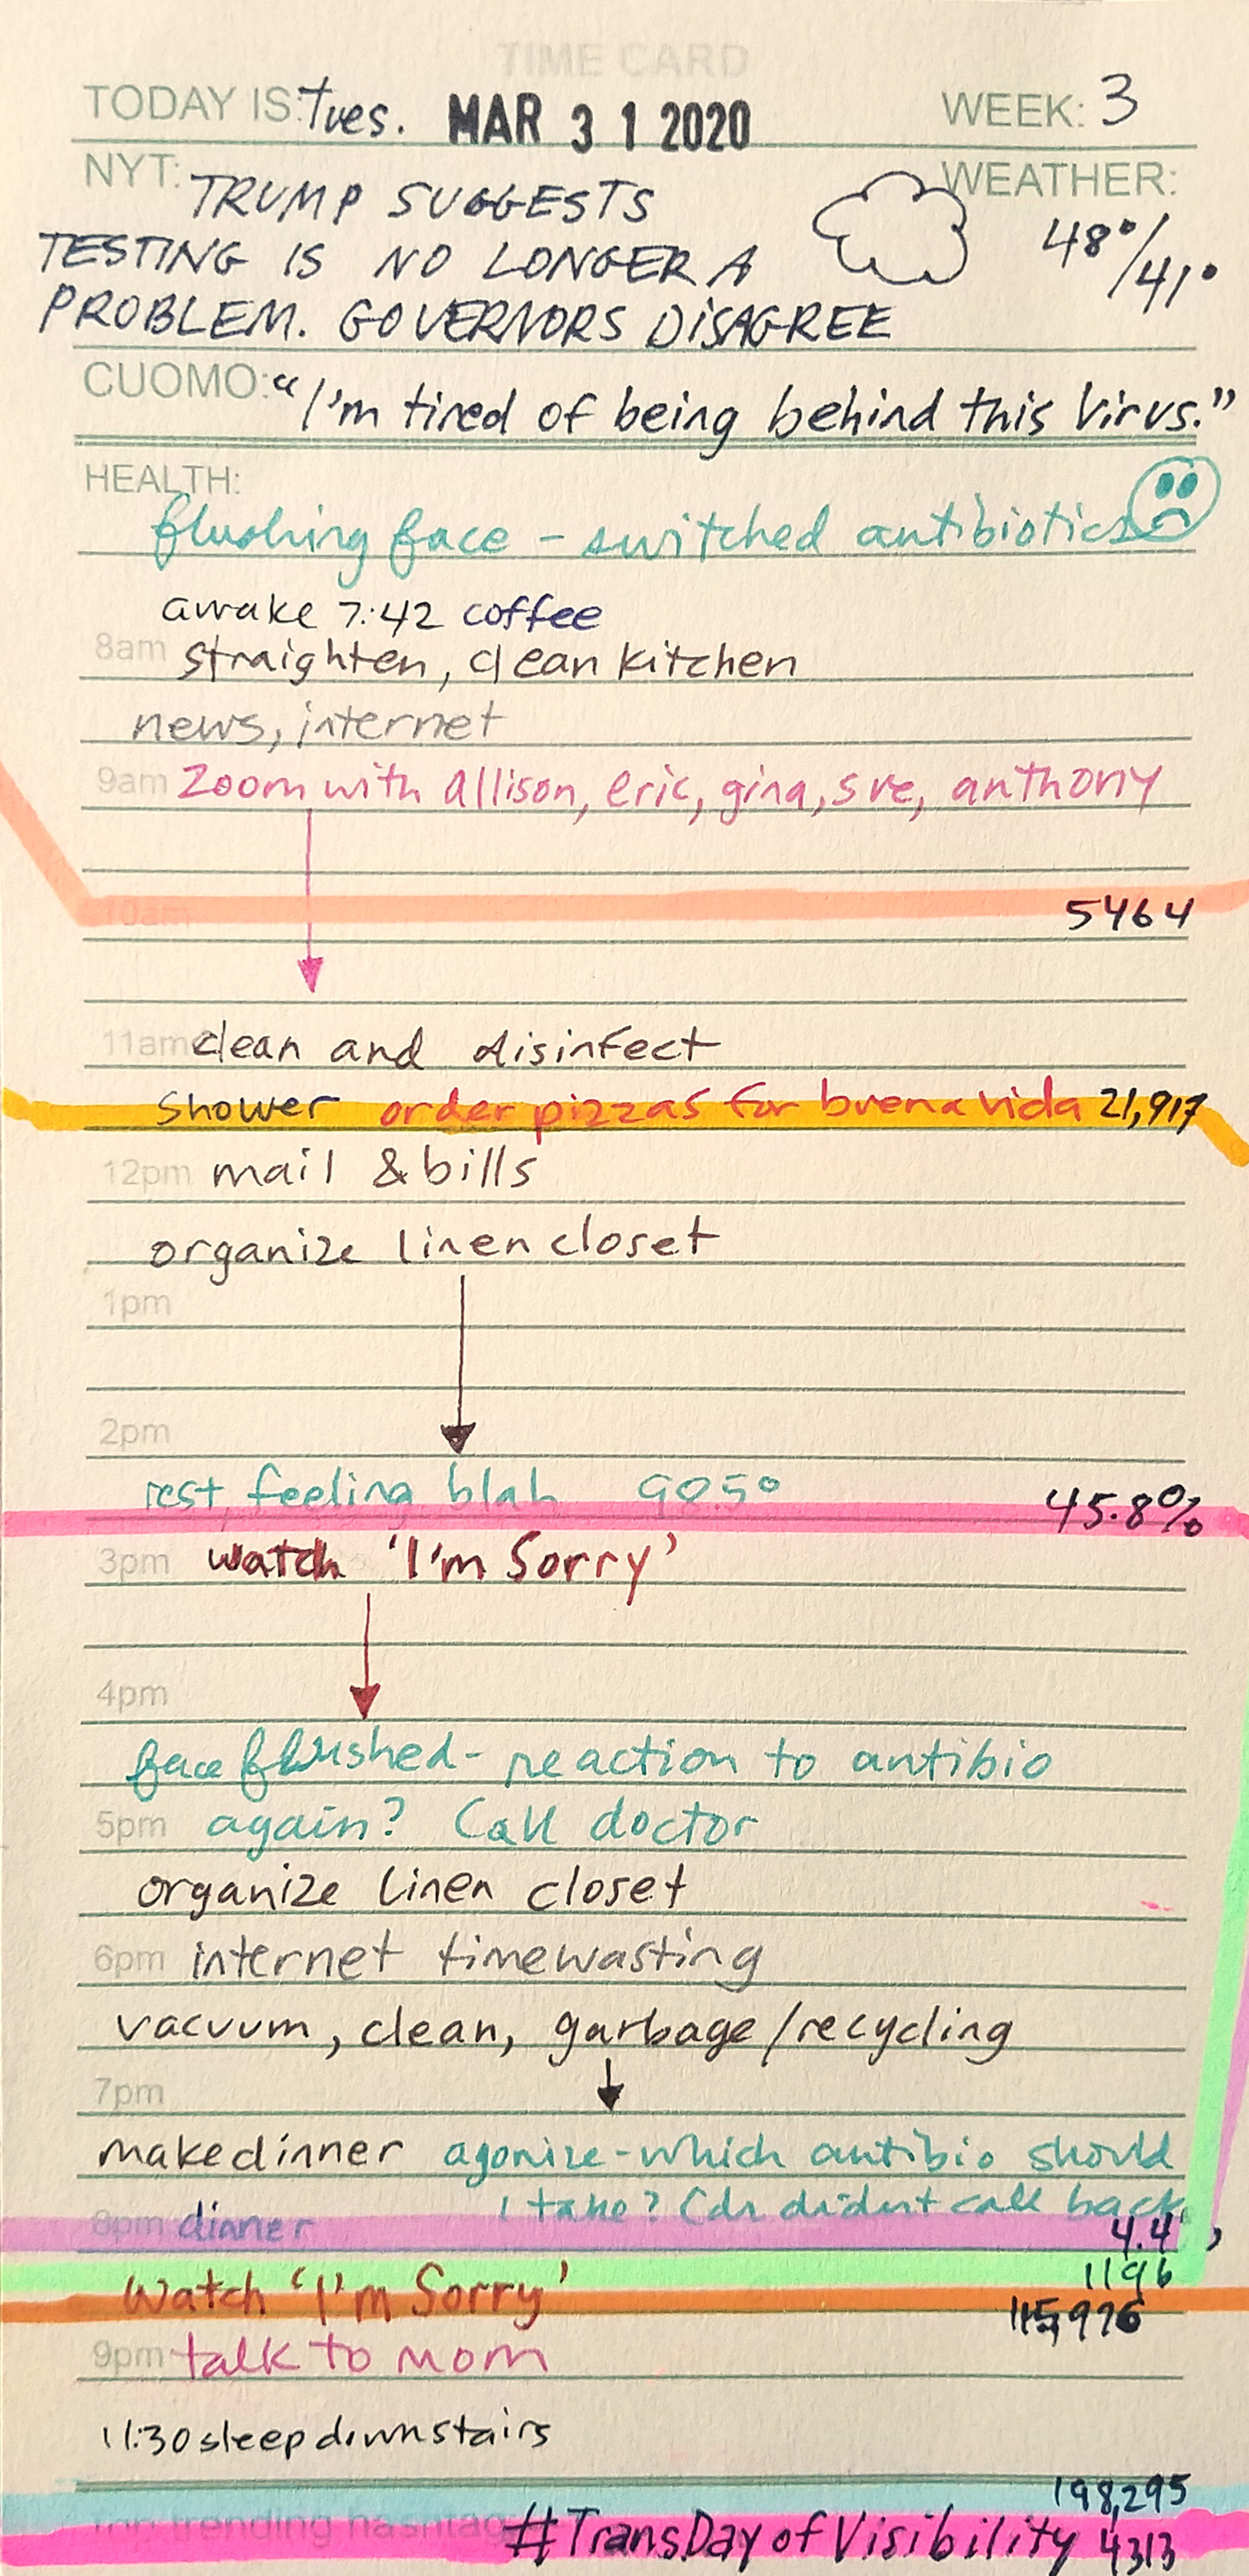


A note on March 2020
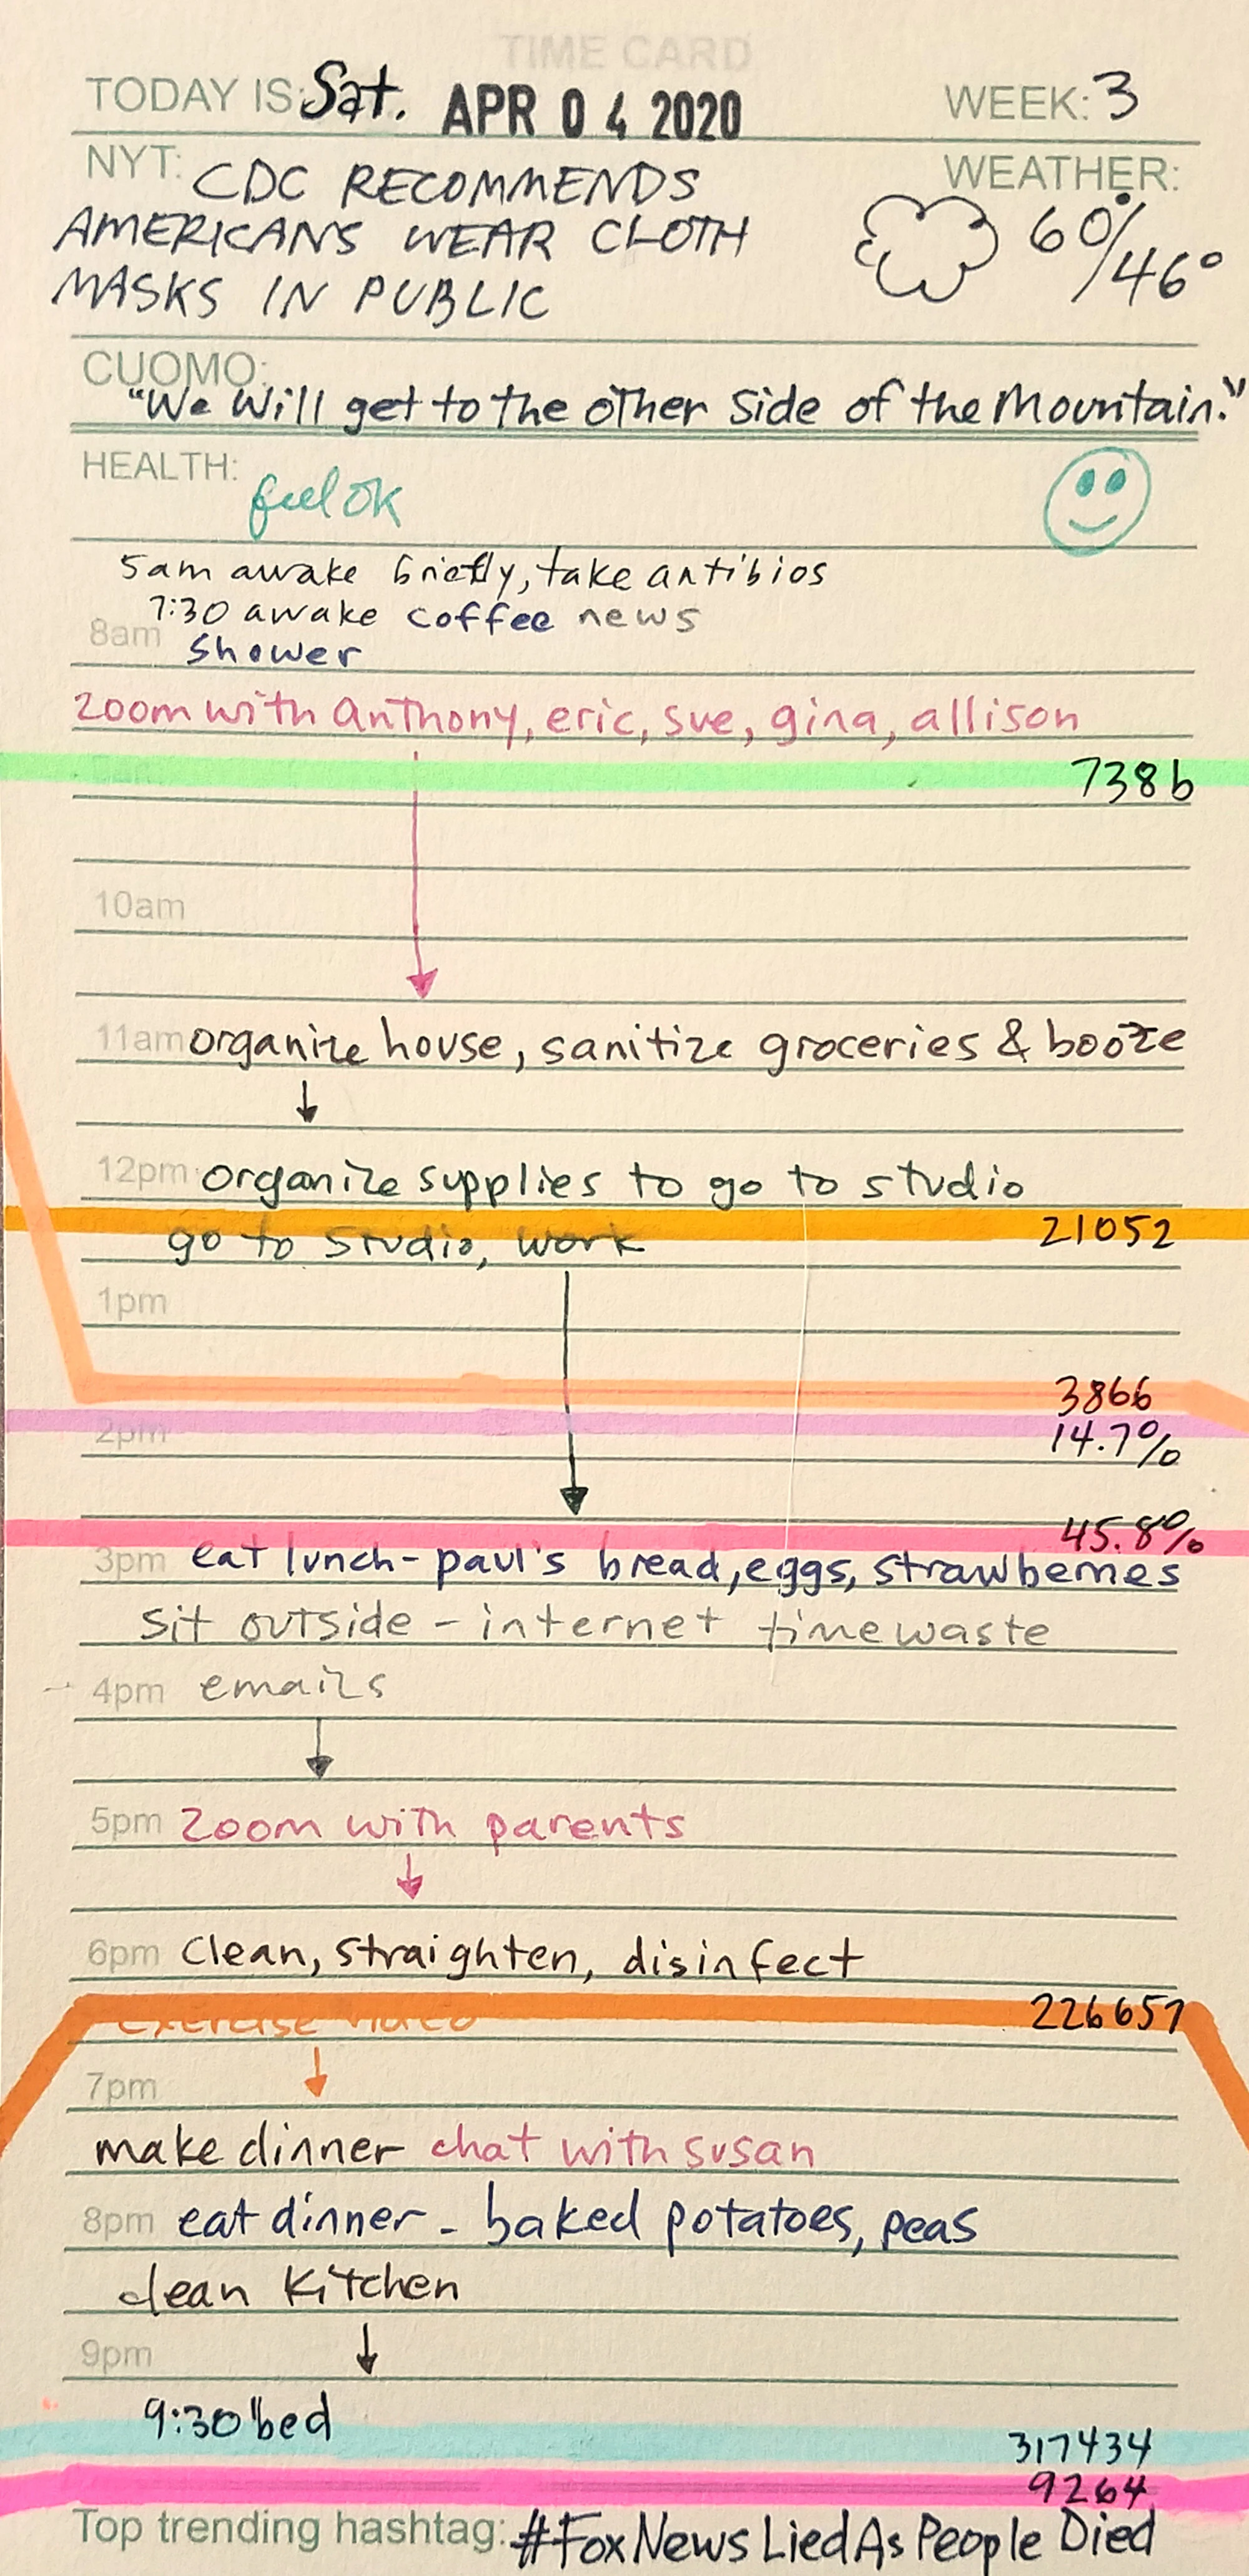
I’ve reconstructed most of my activity in March from my calendar, photos, texts and emails. I began consistently logging my activity on March 25th but it felt important to include the transition from normal life to lockdown, as well as the COVID, cultural and economic data for March.
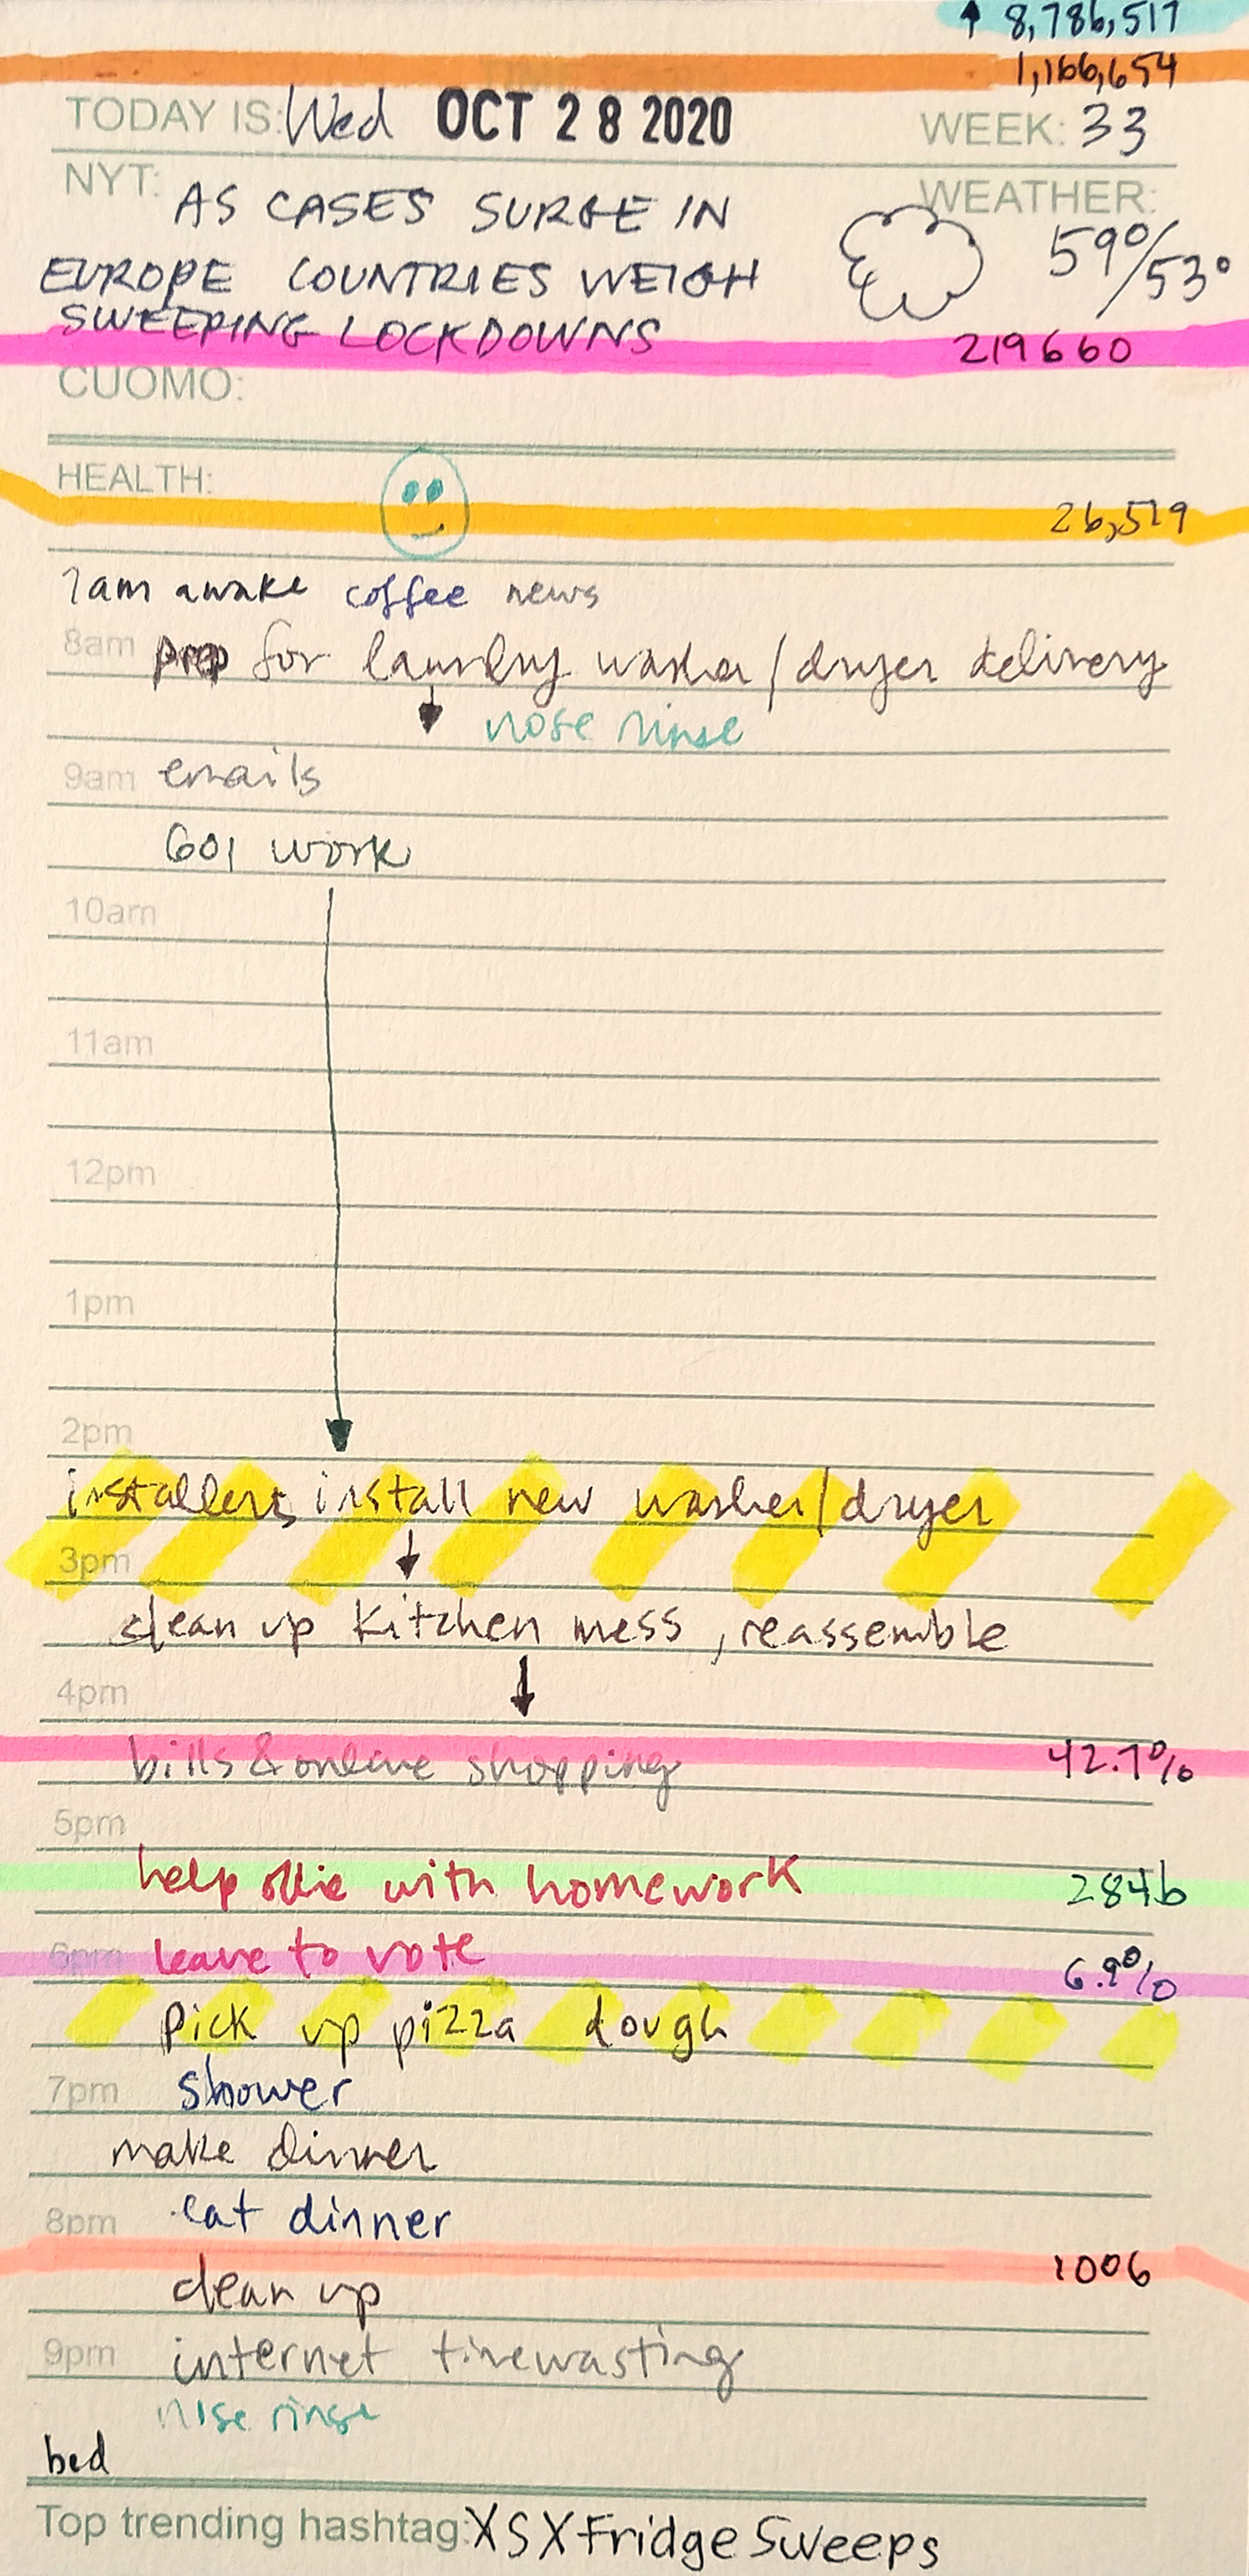
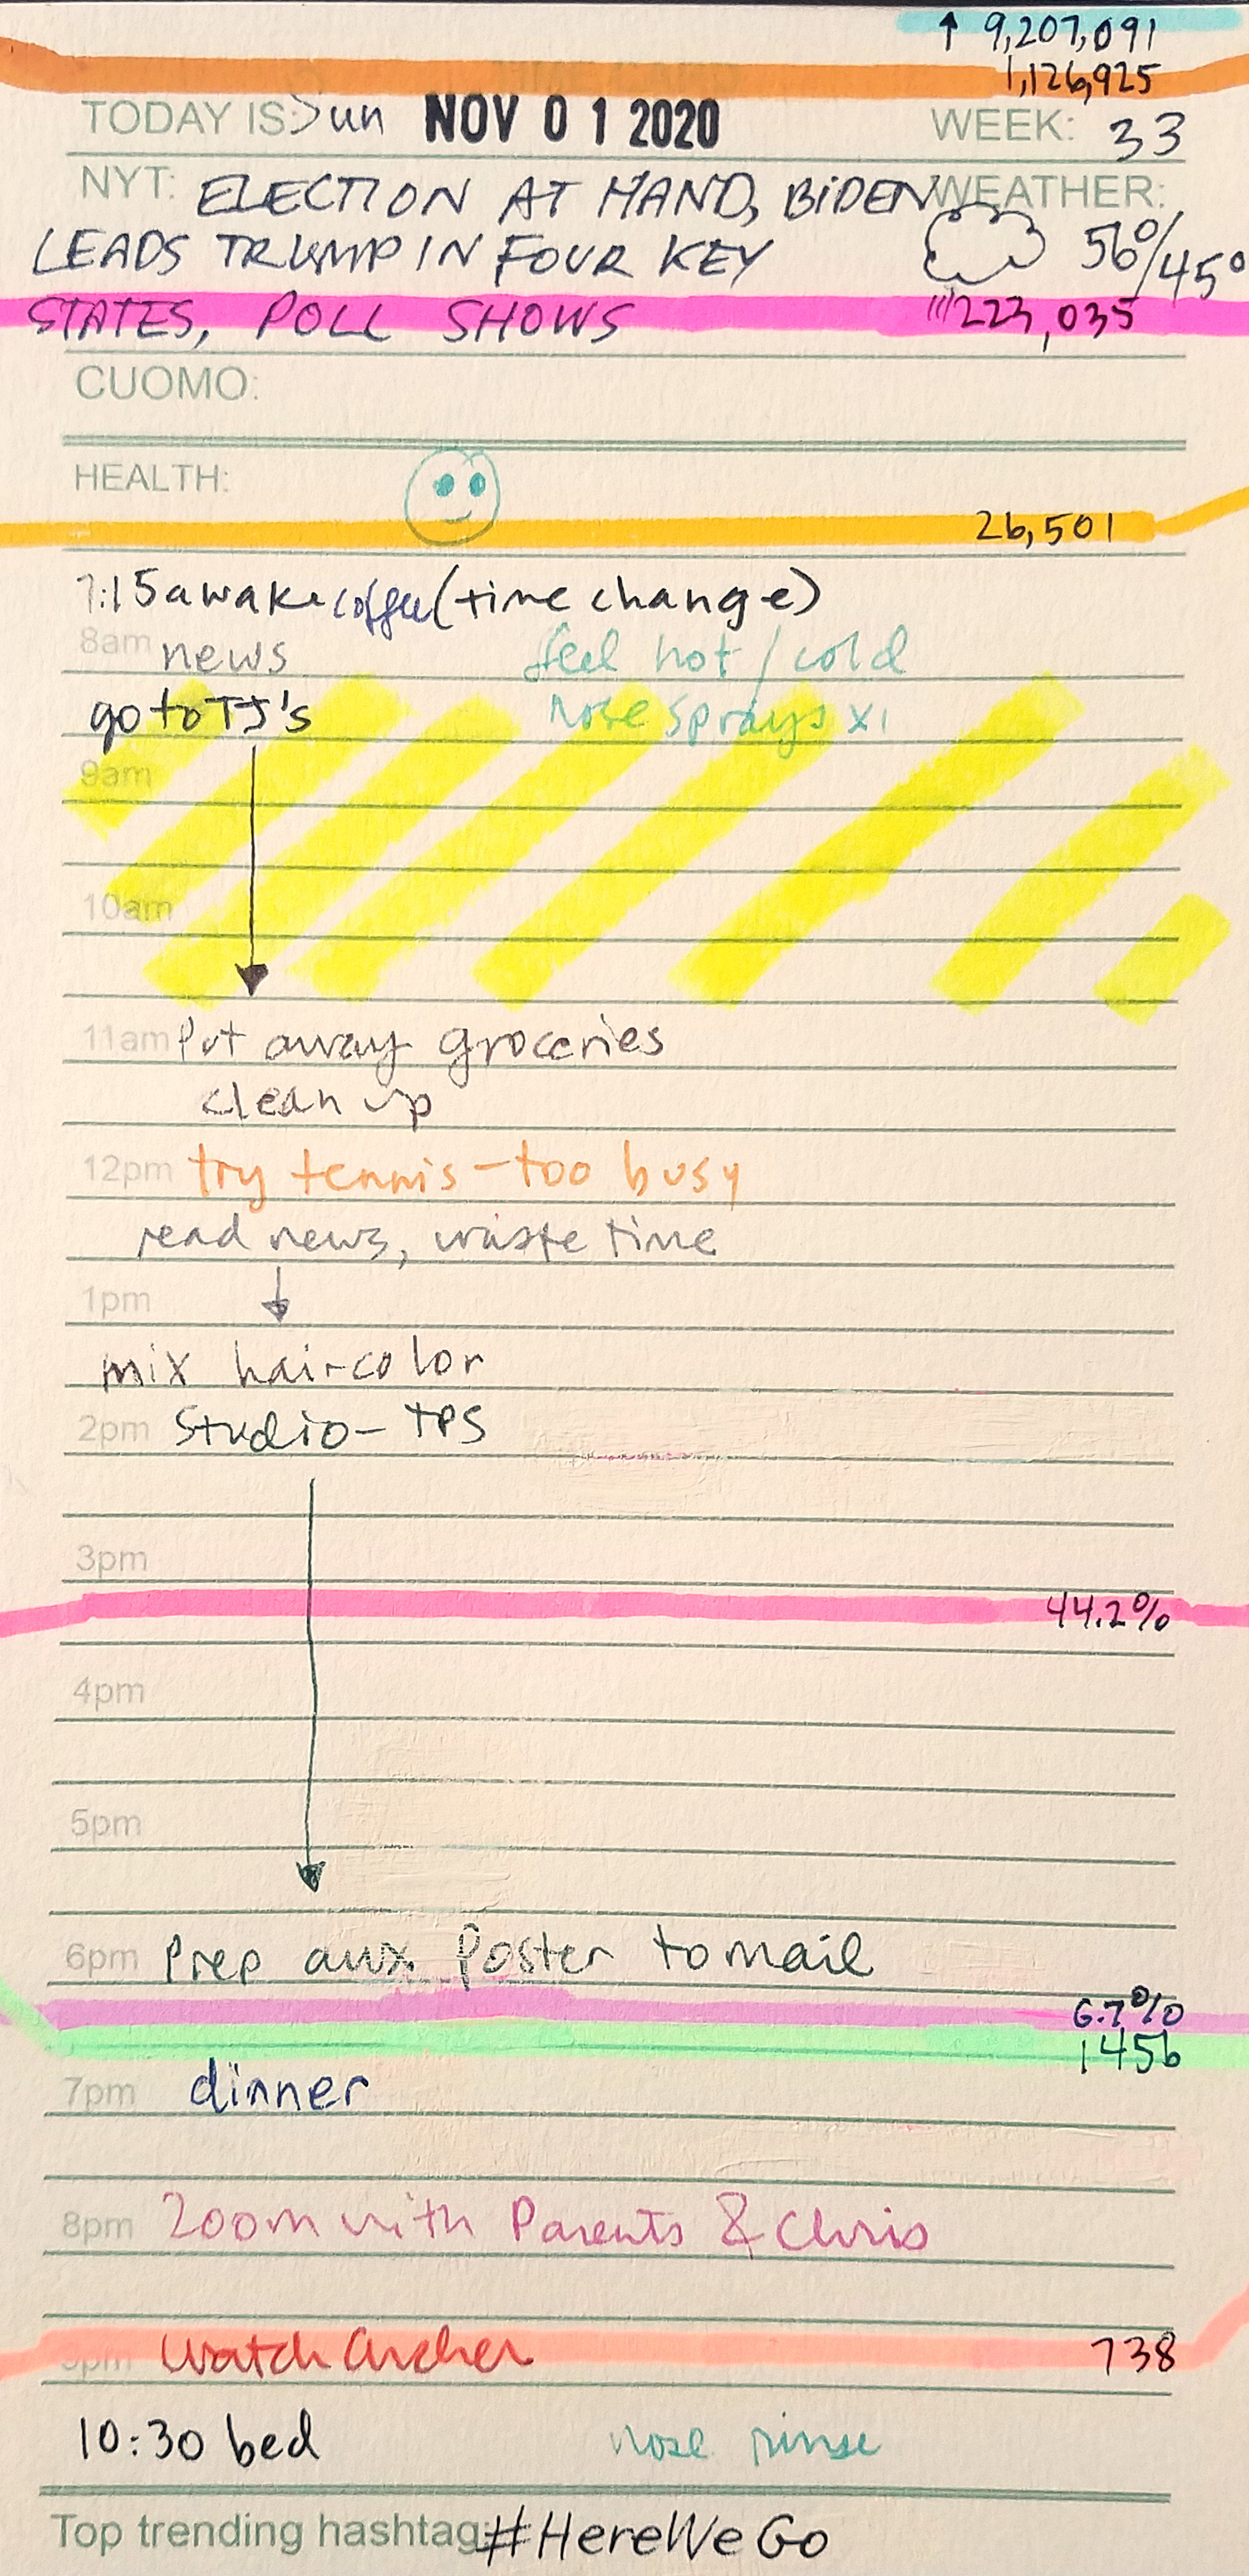
Part 2: July 1, 2020 - October 31, 2020


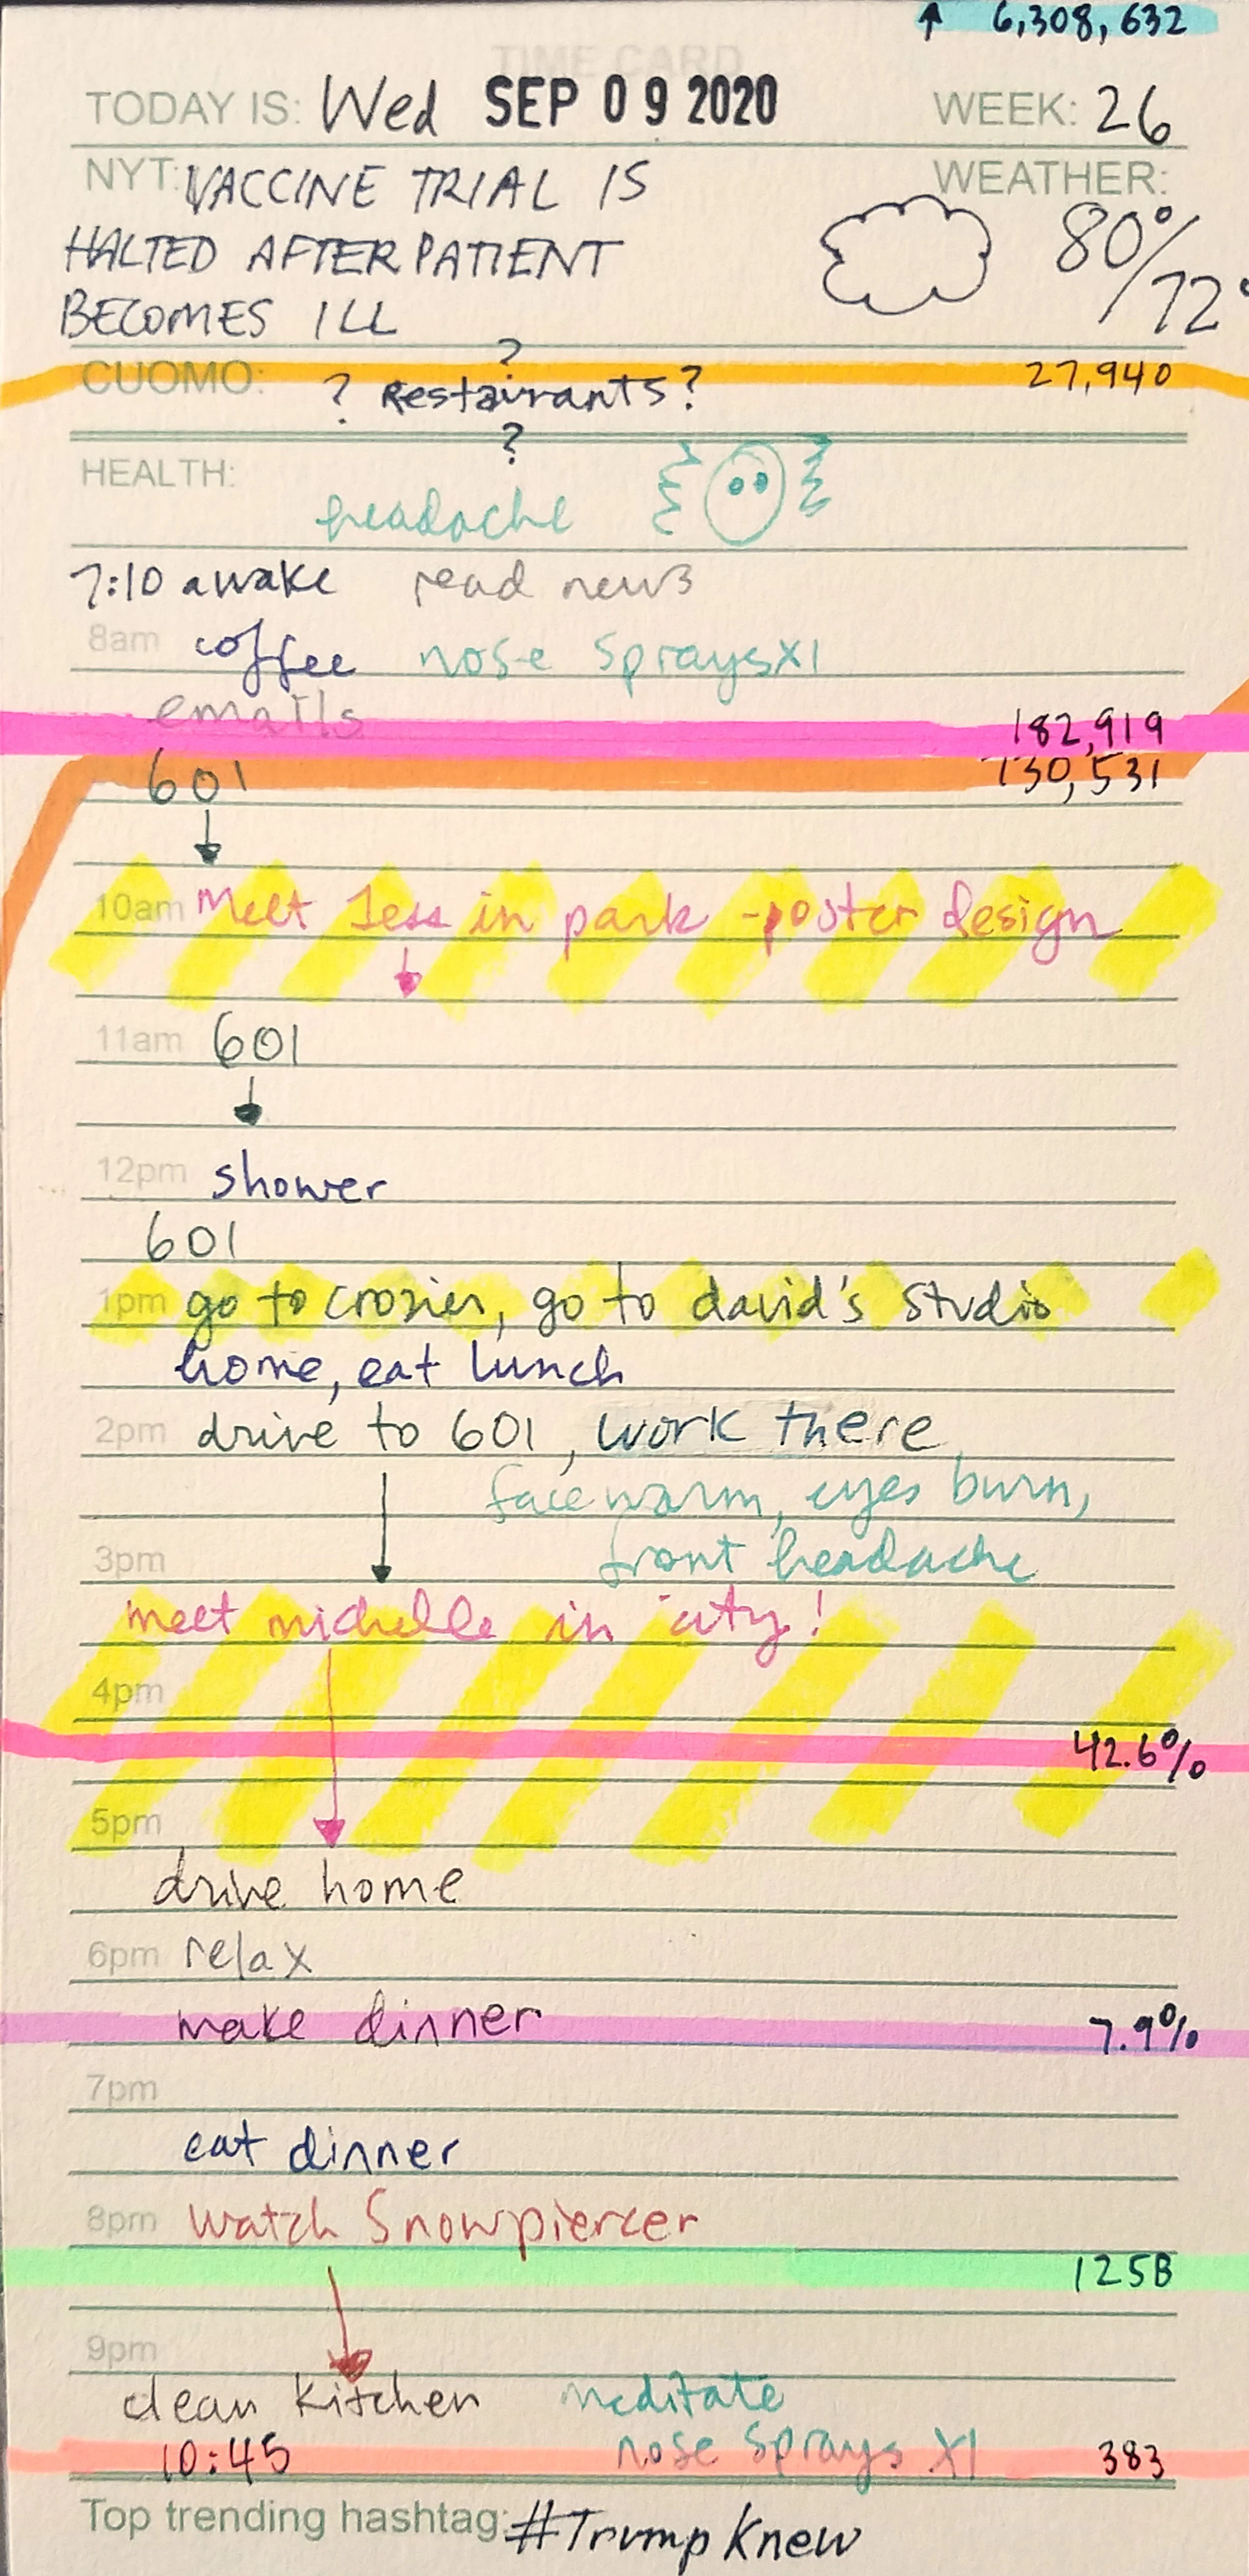
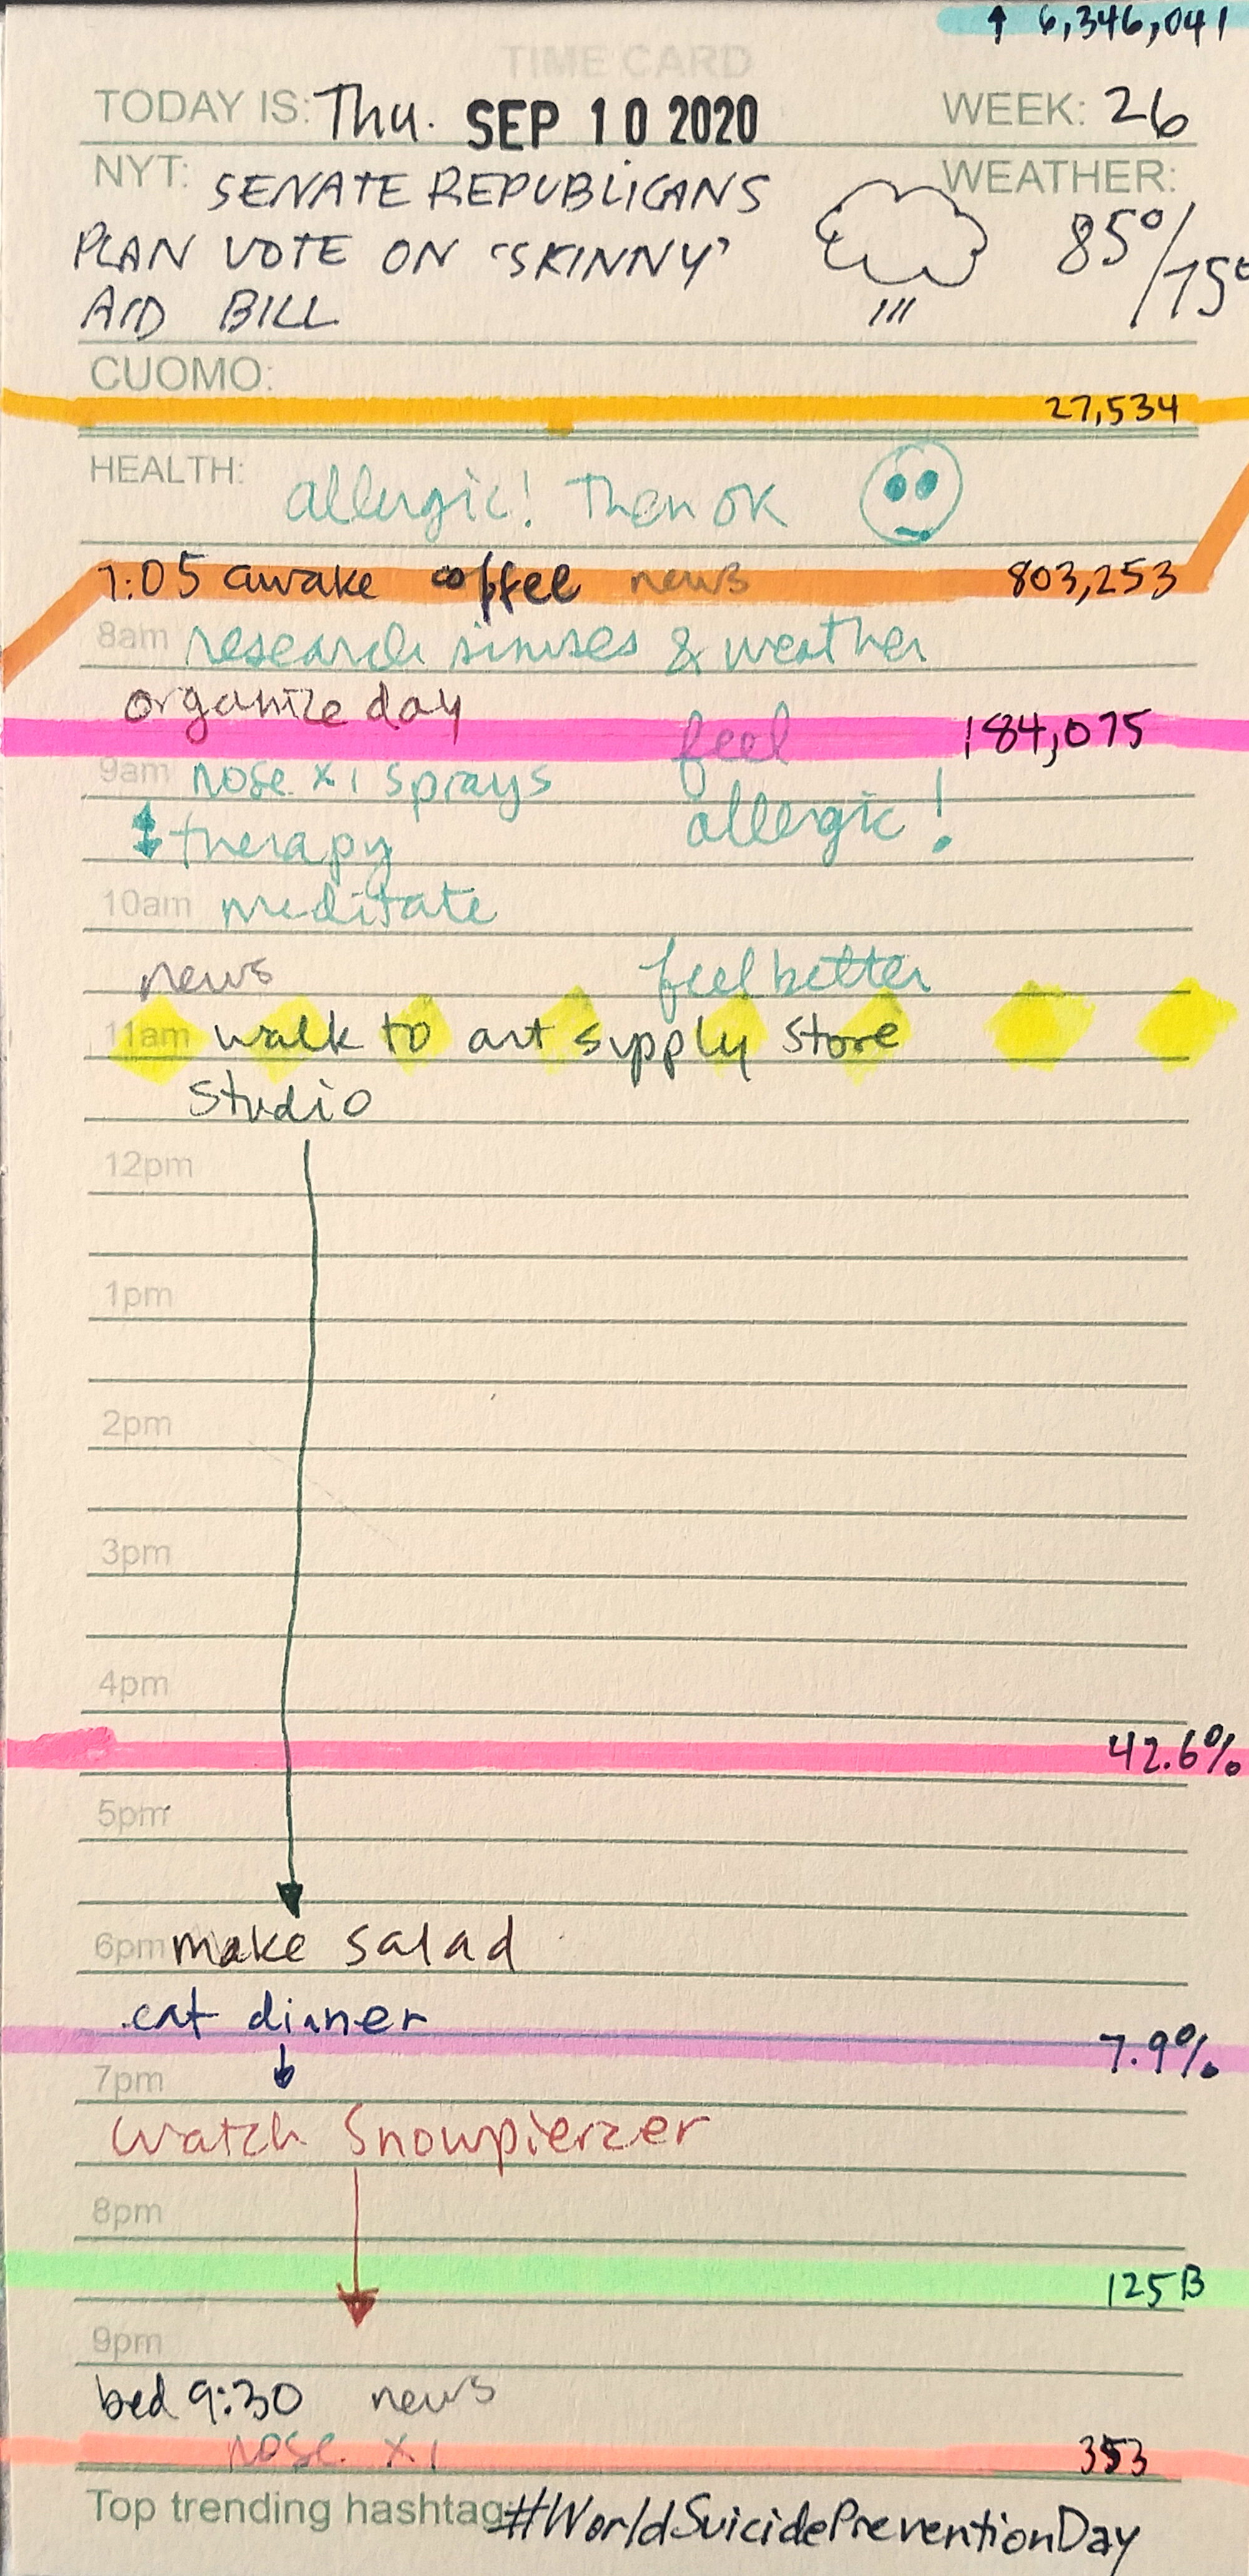


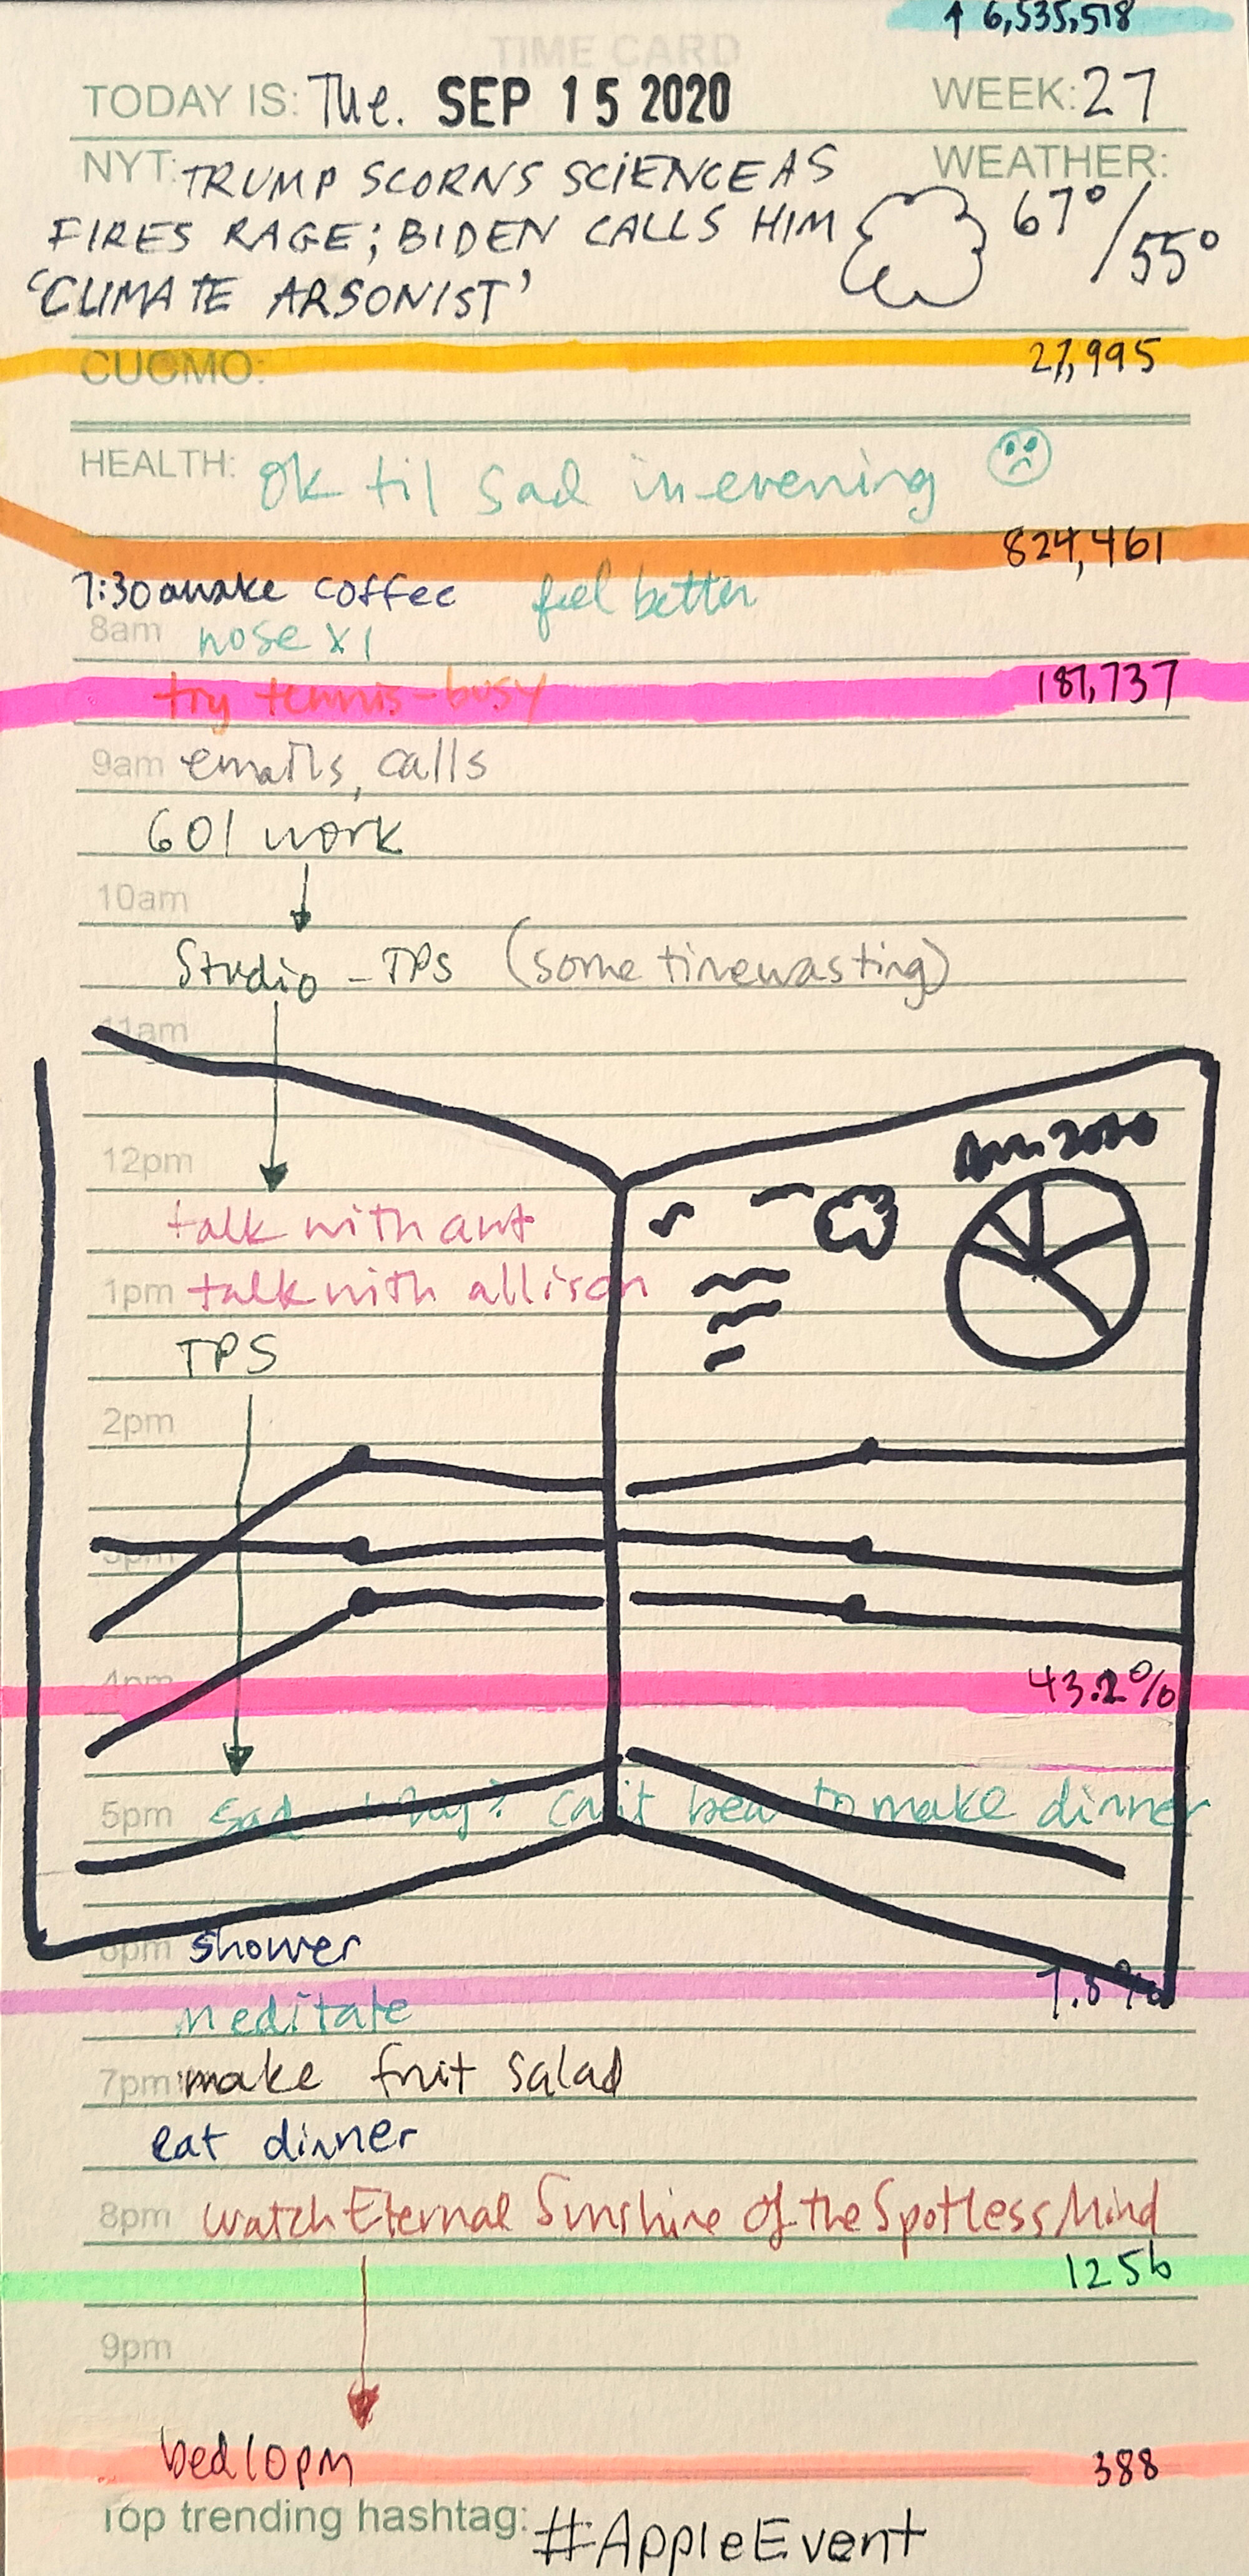


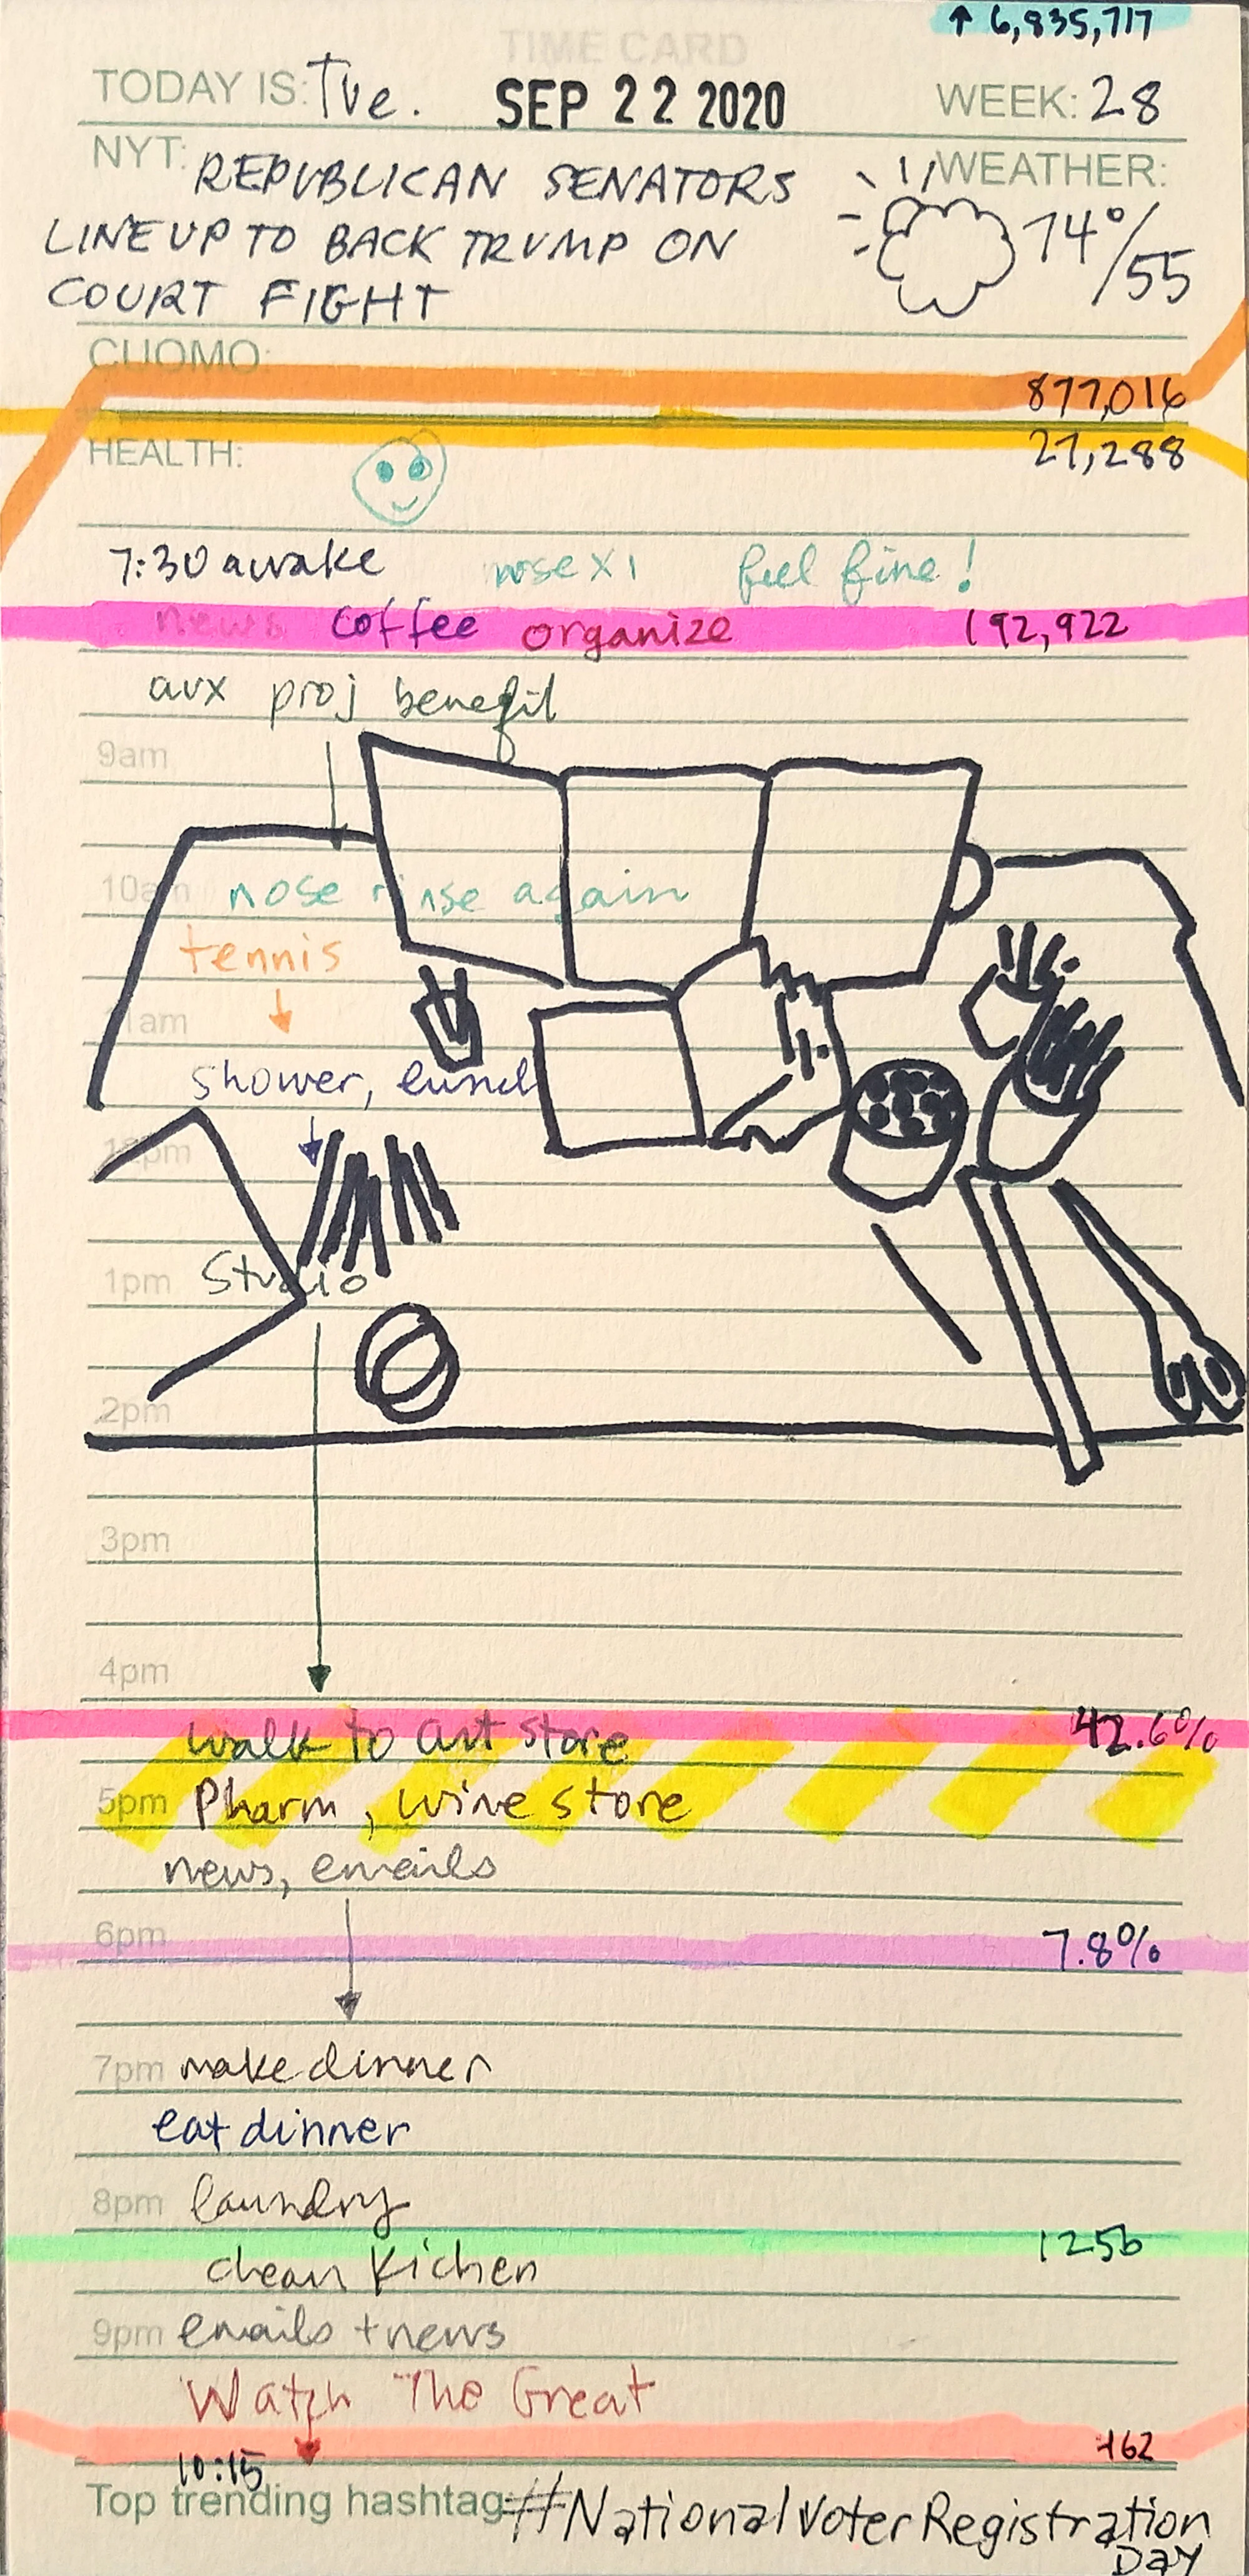


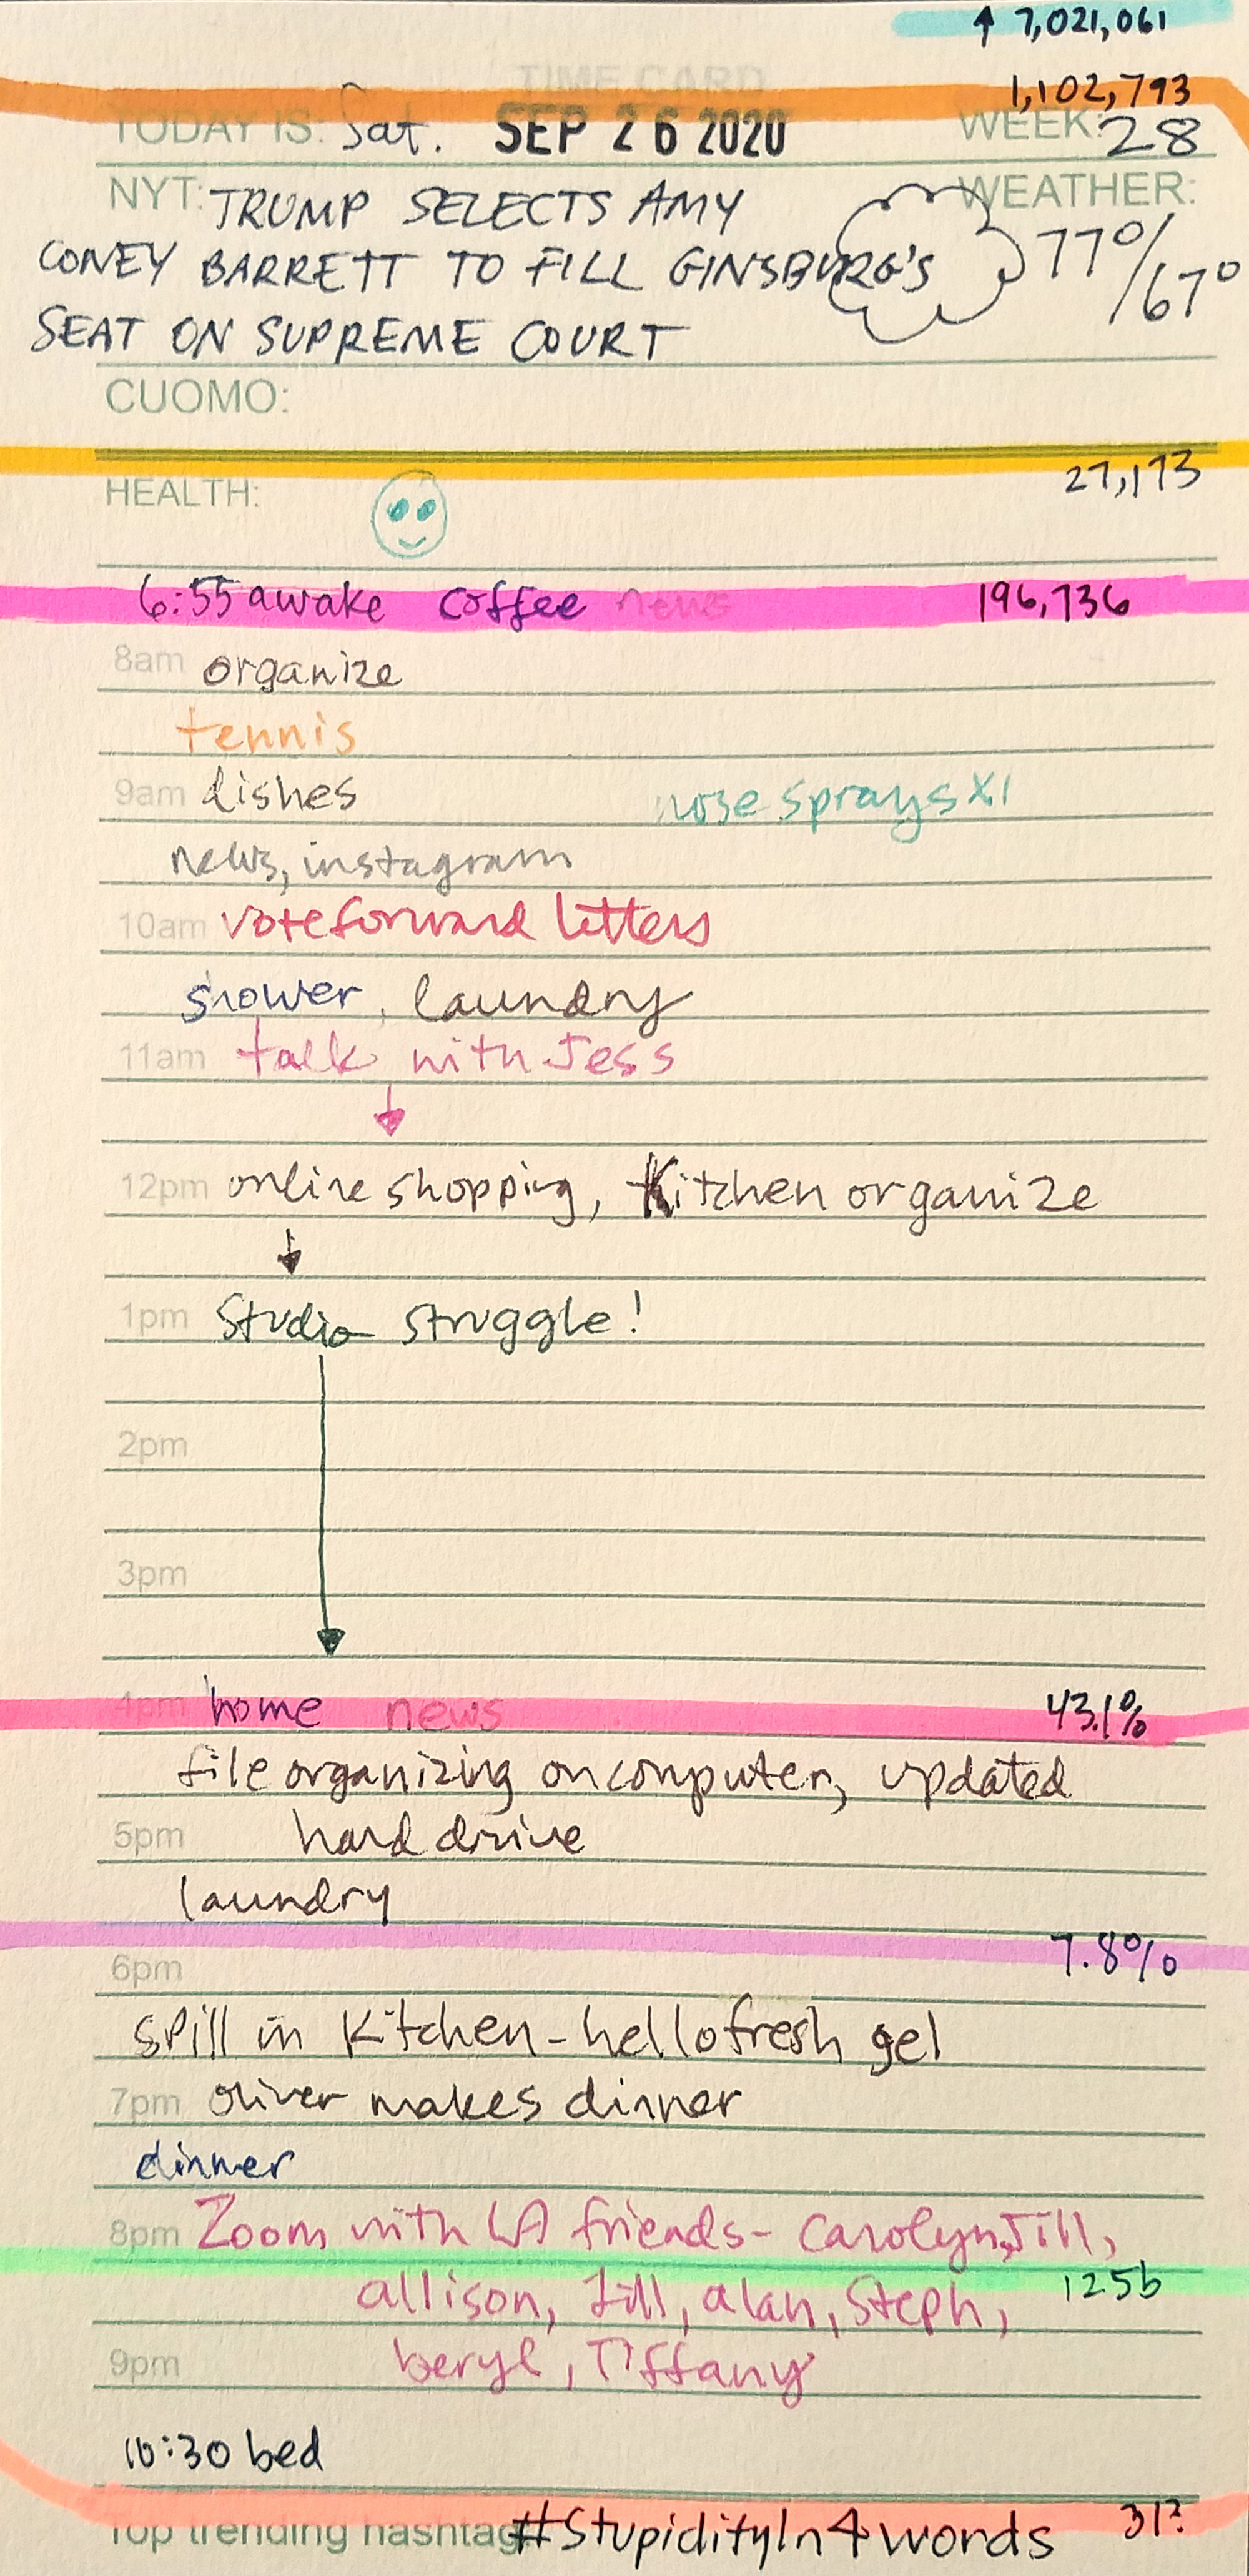

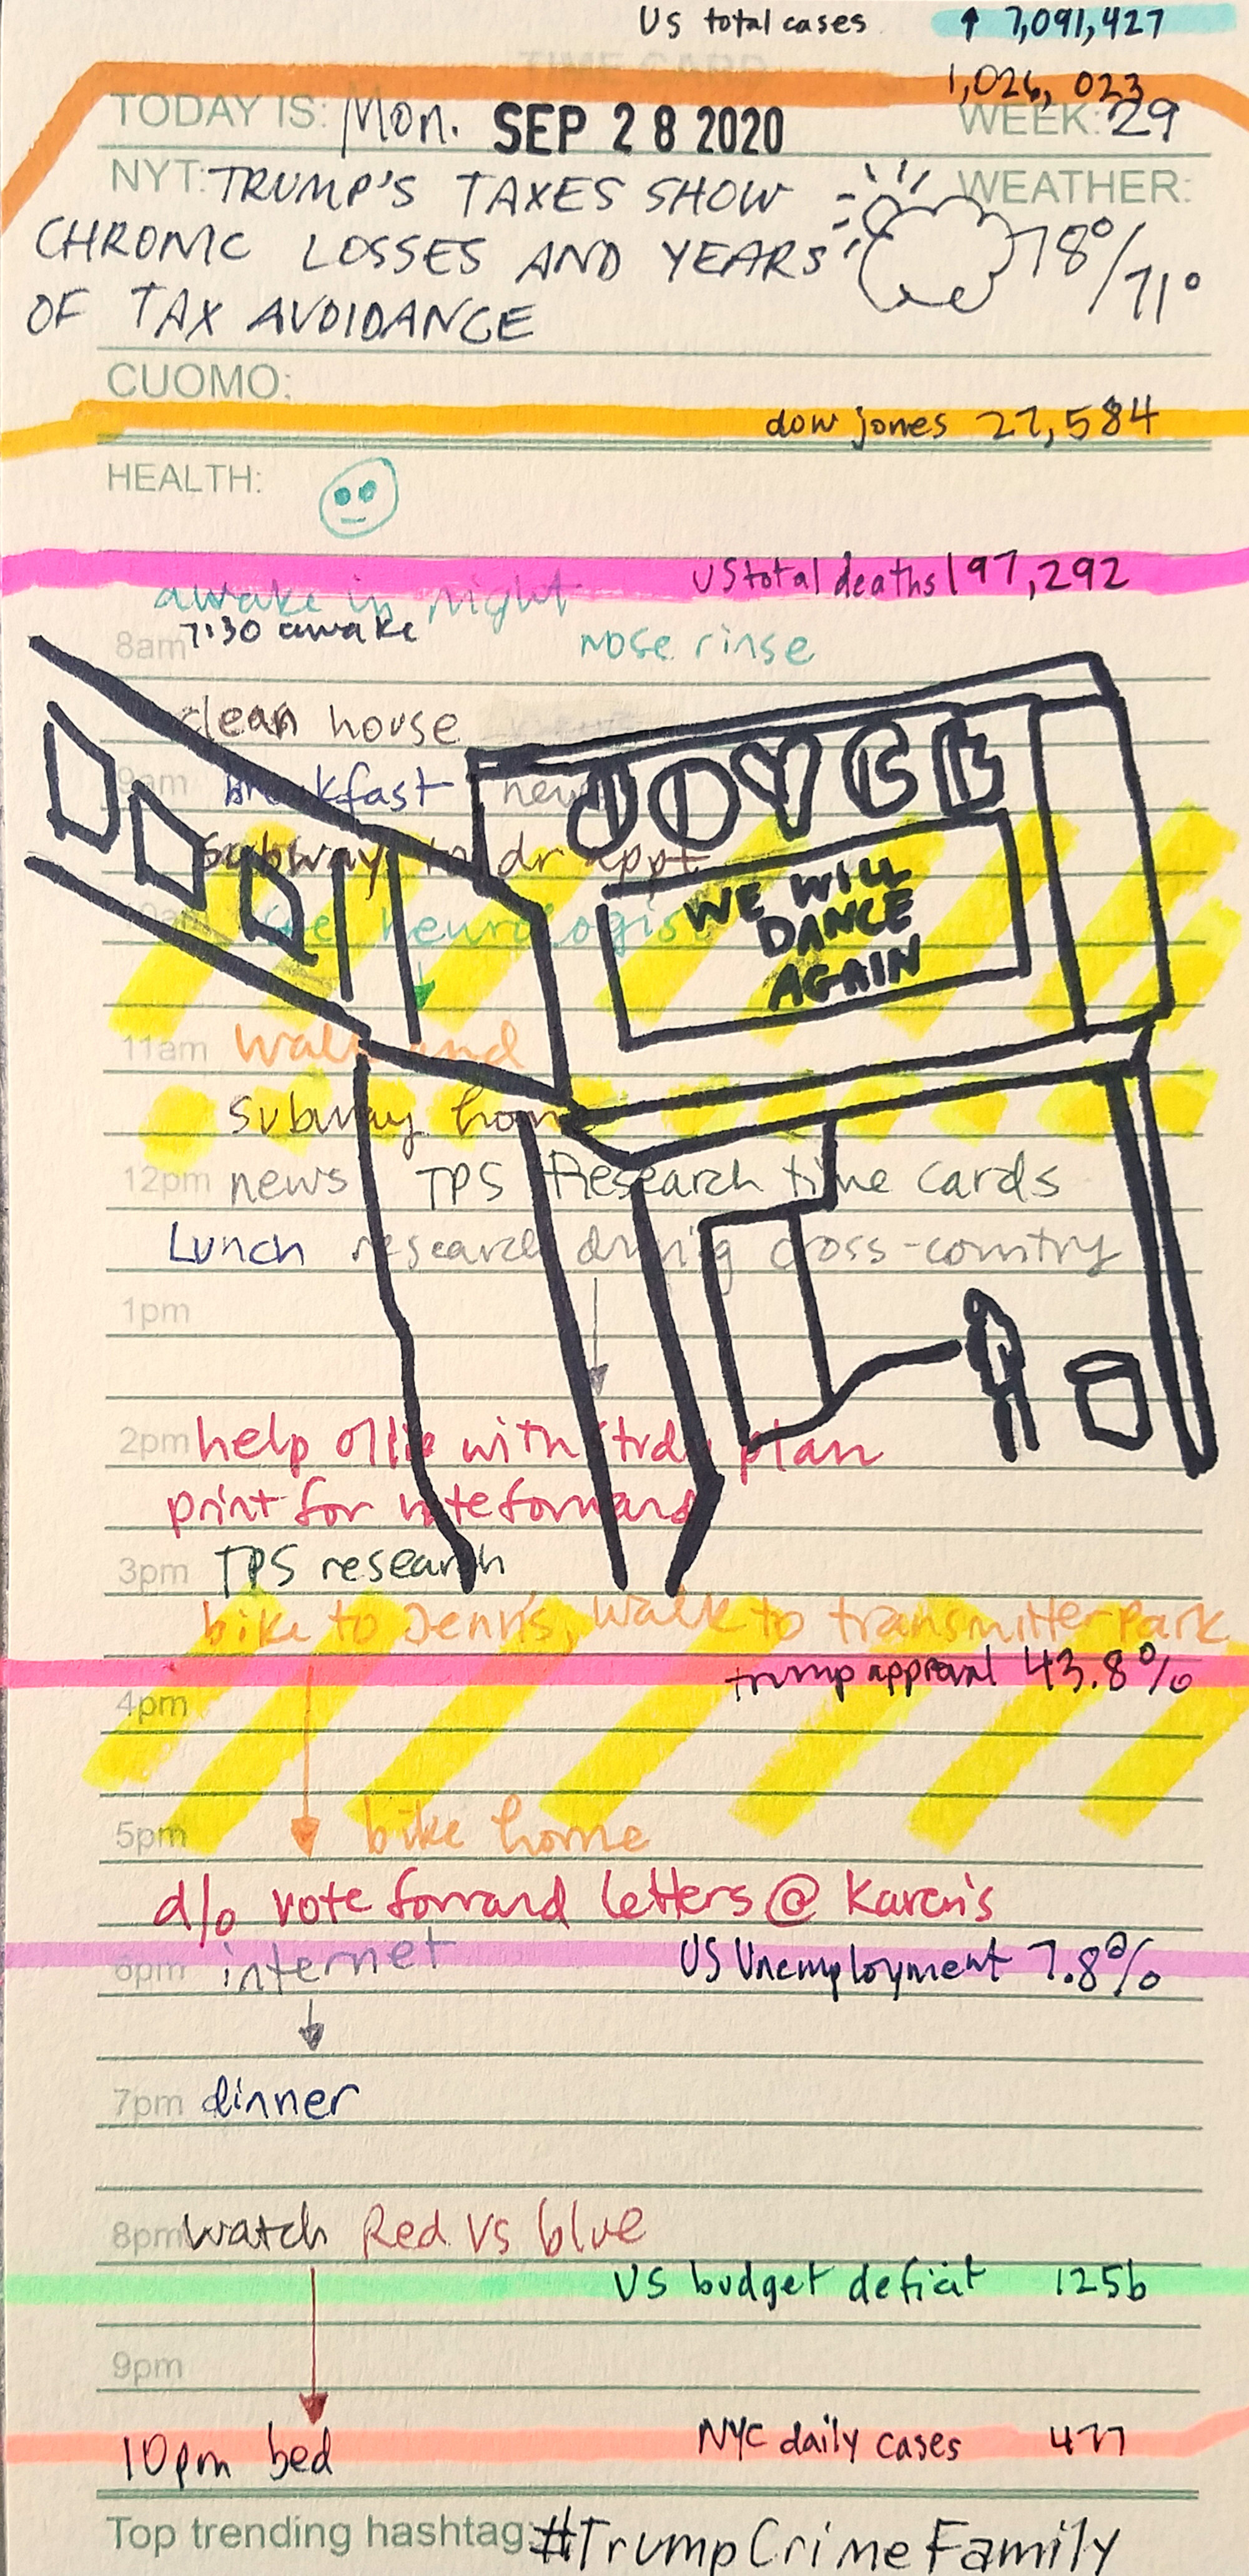

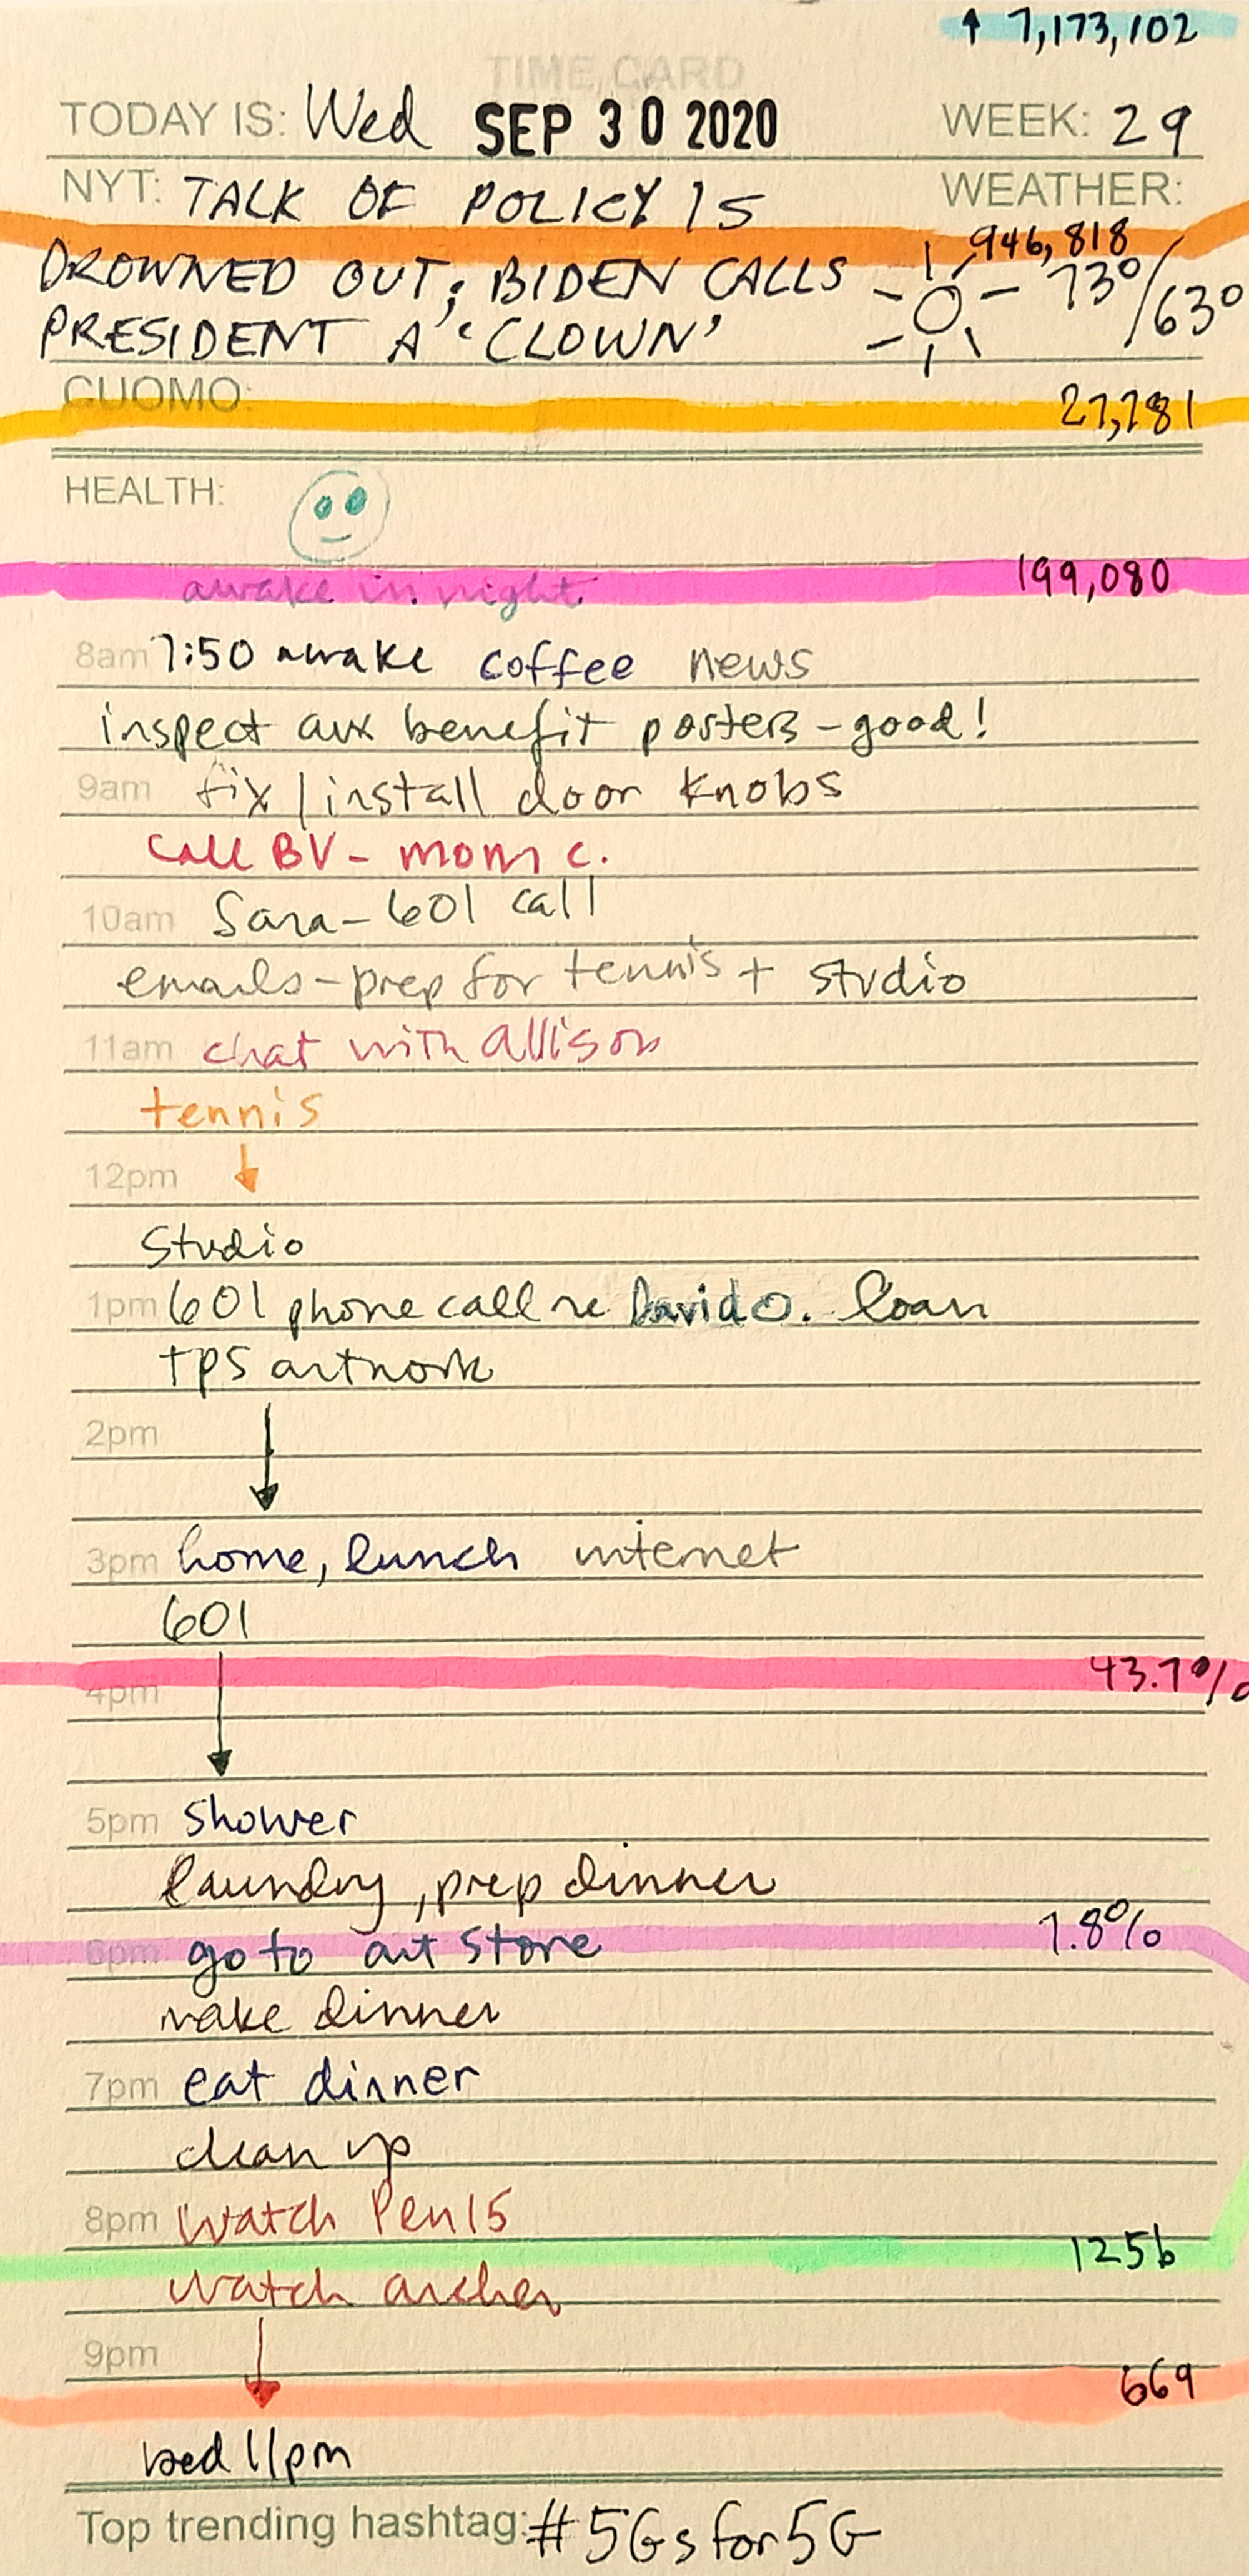


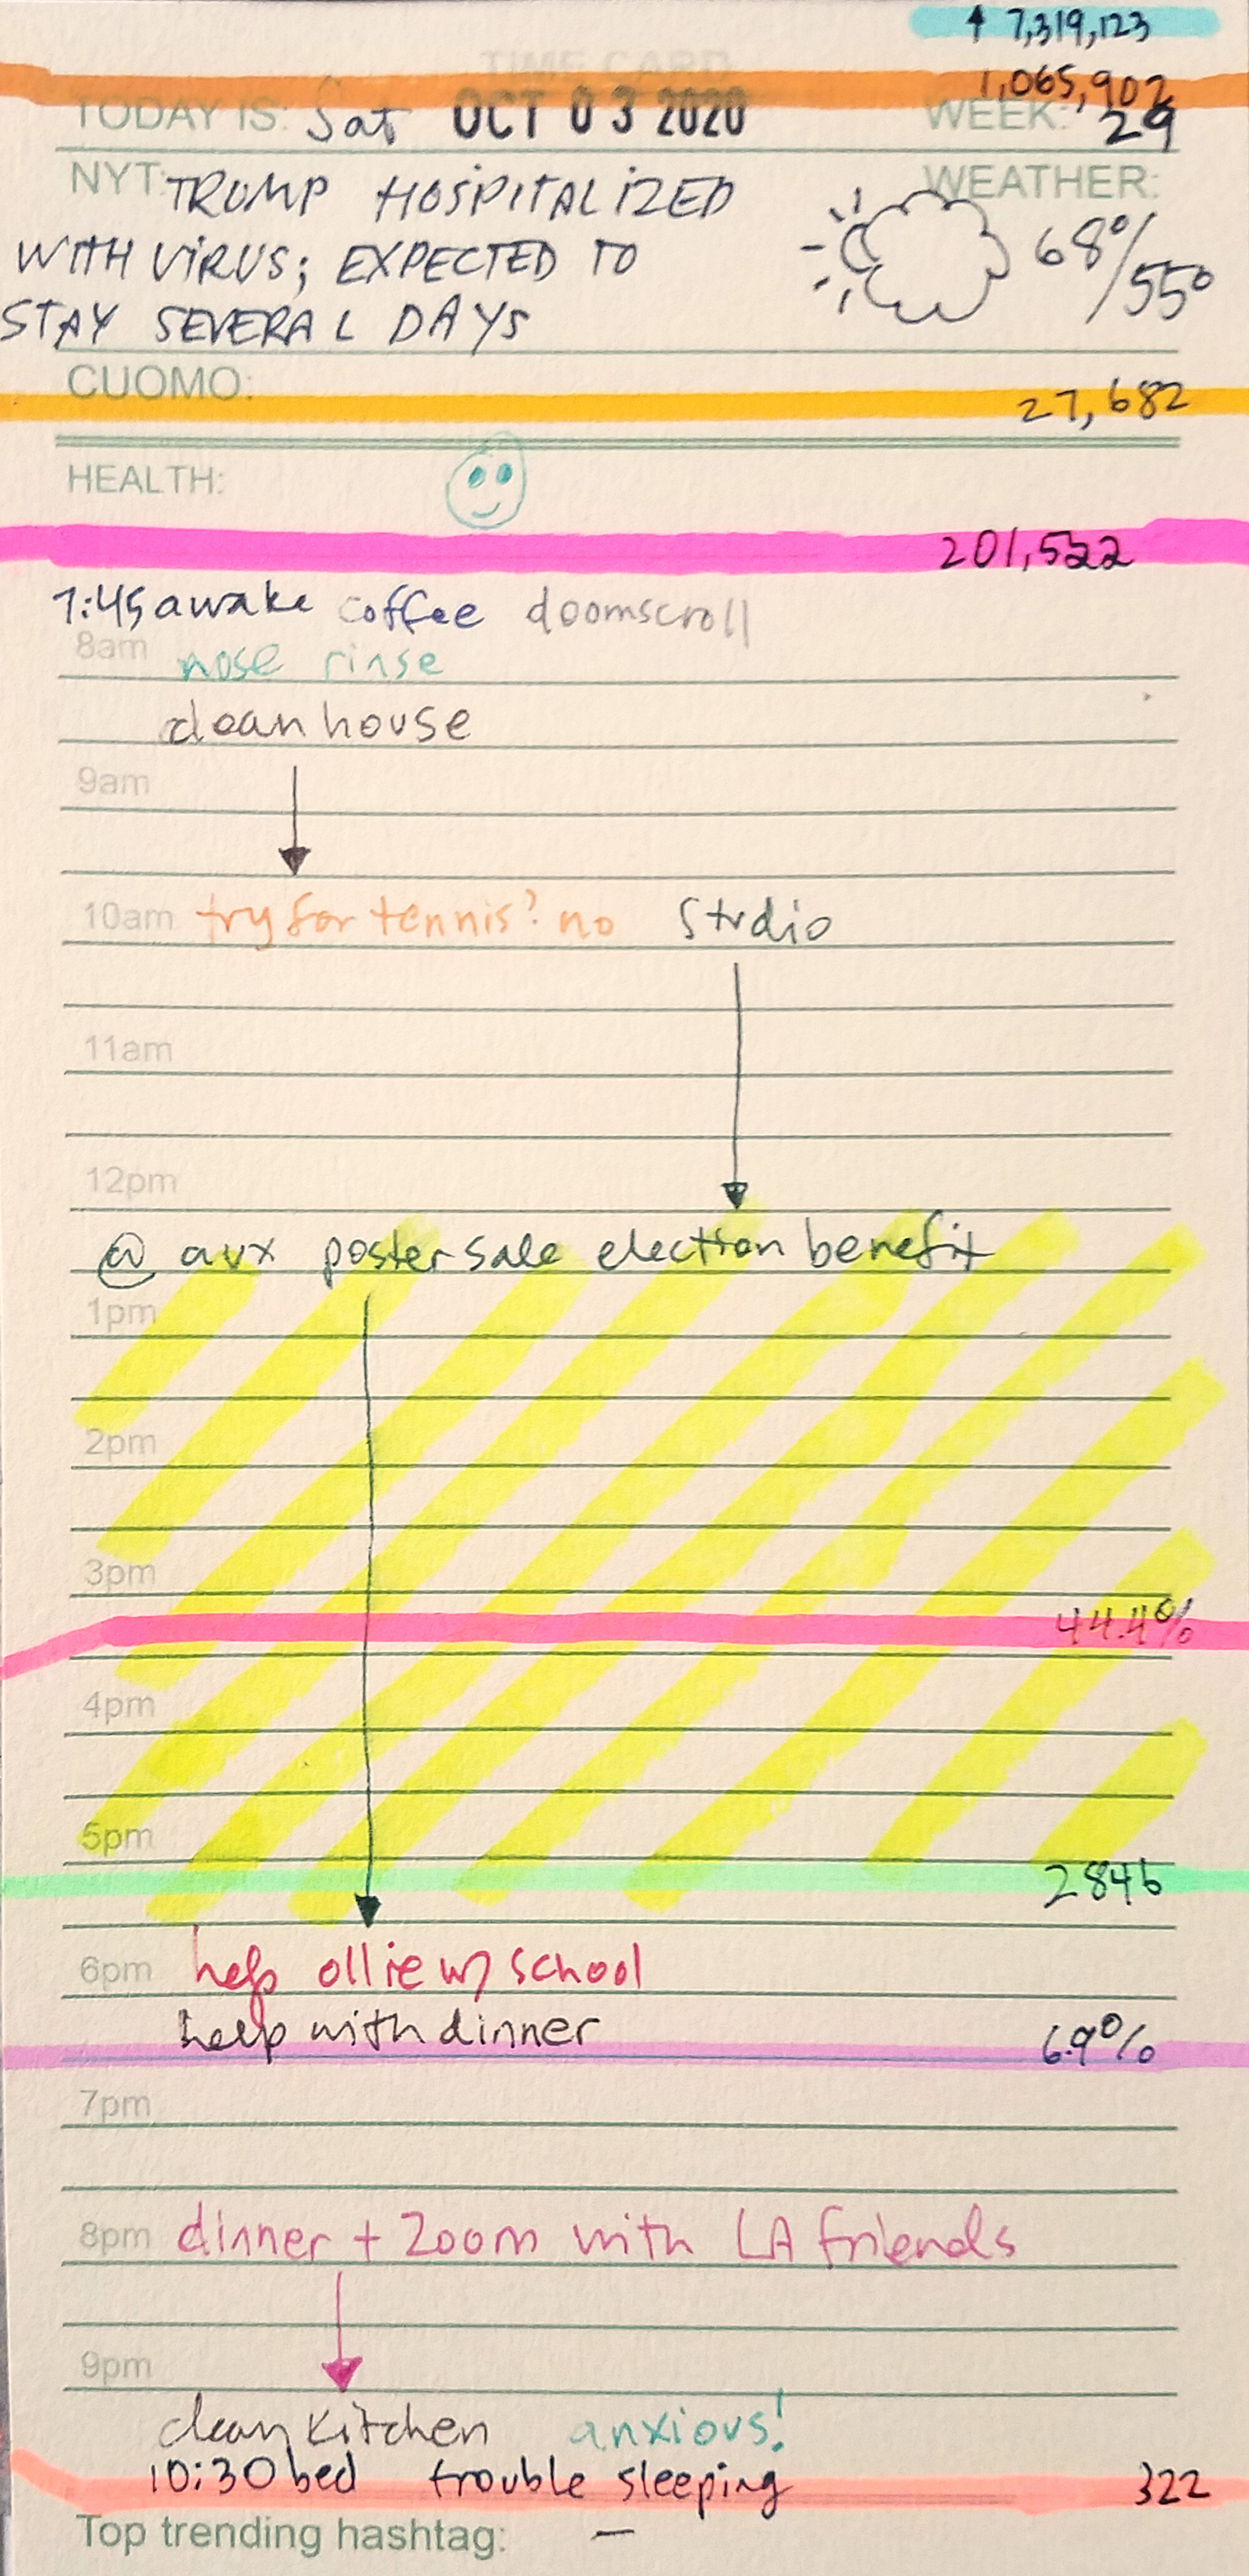


A note on all the days
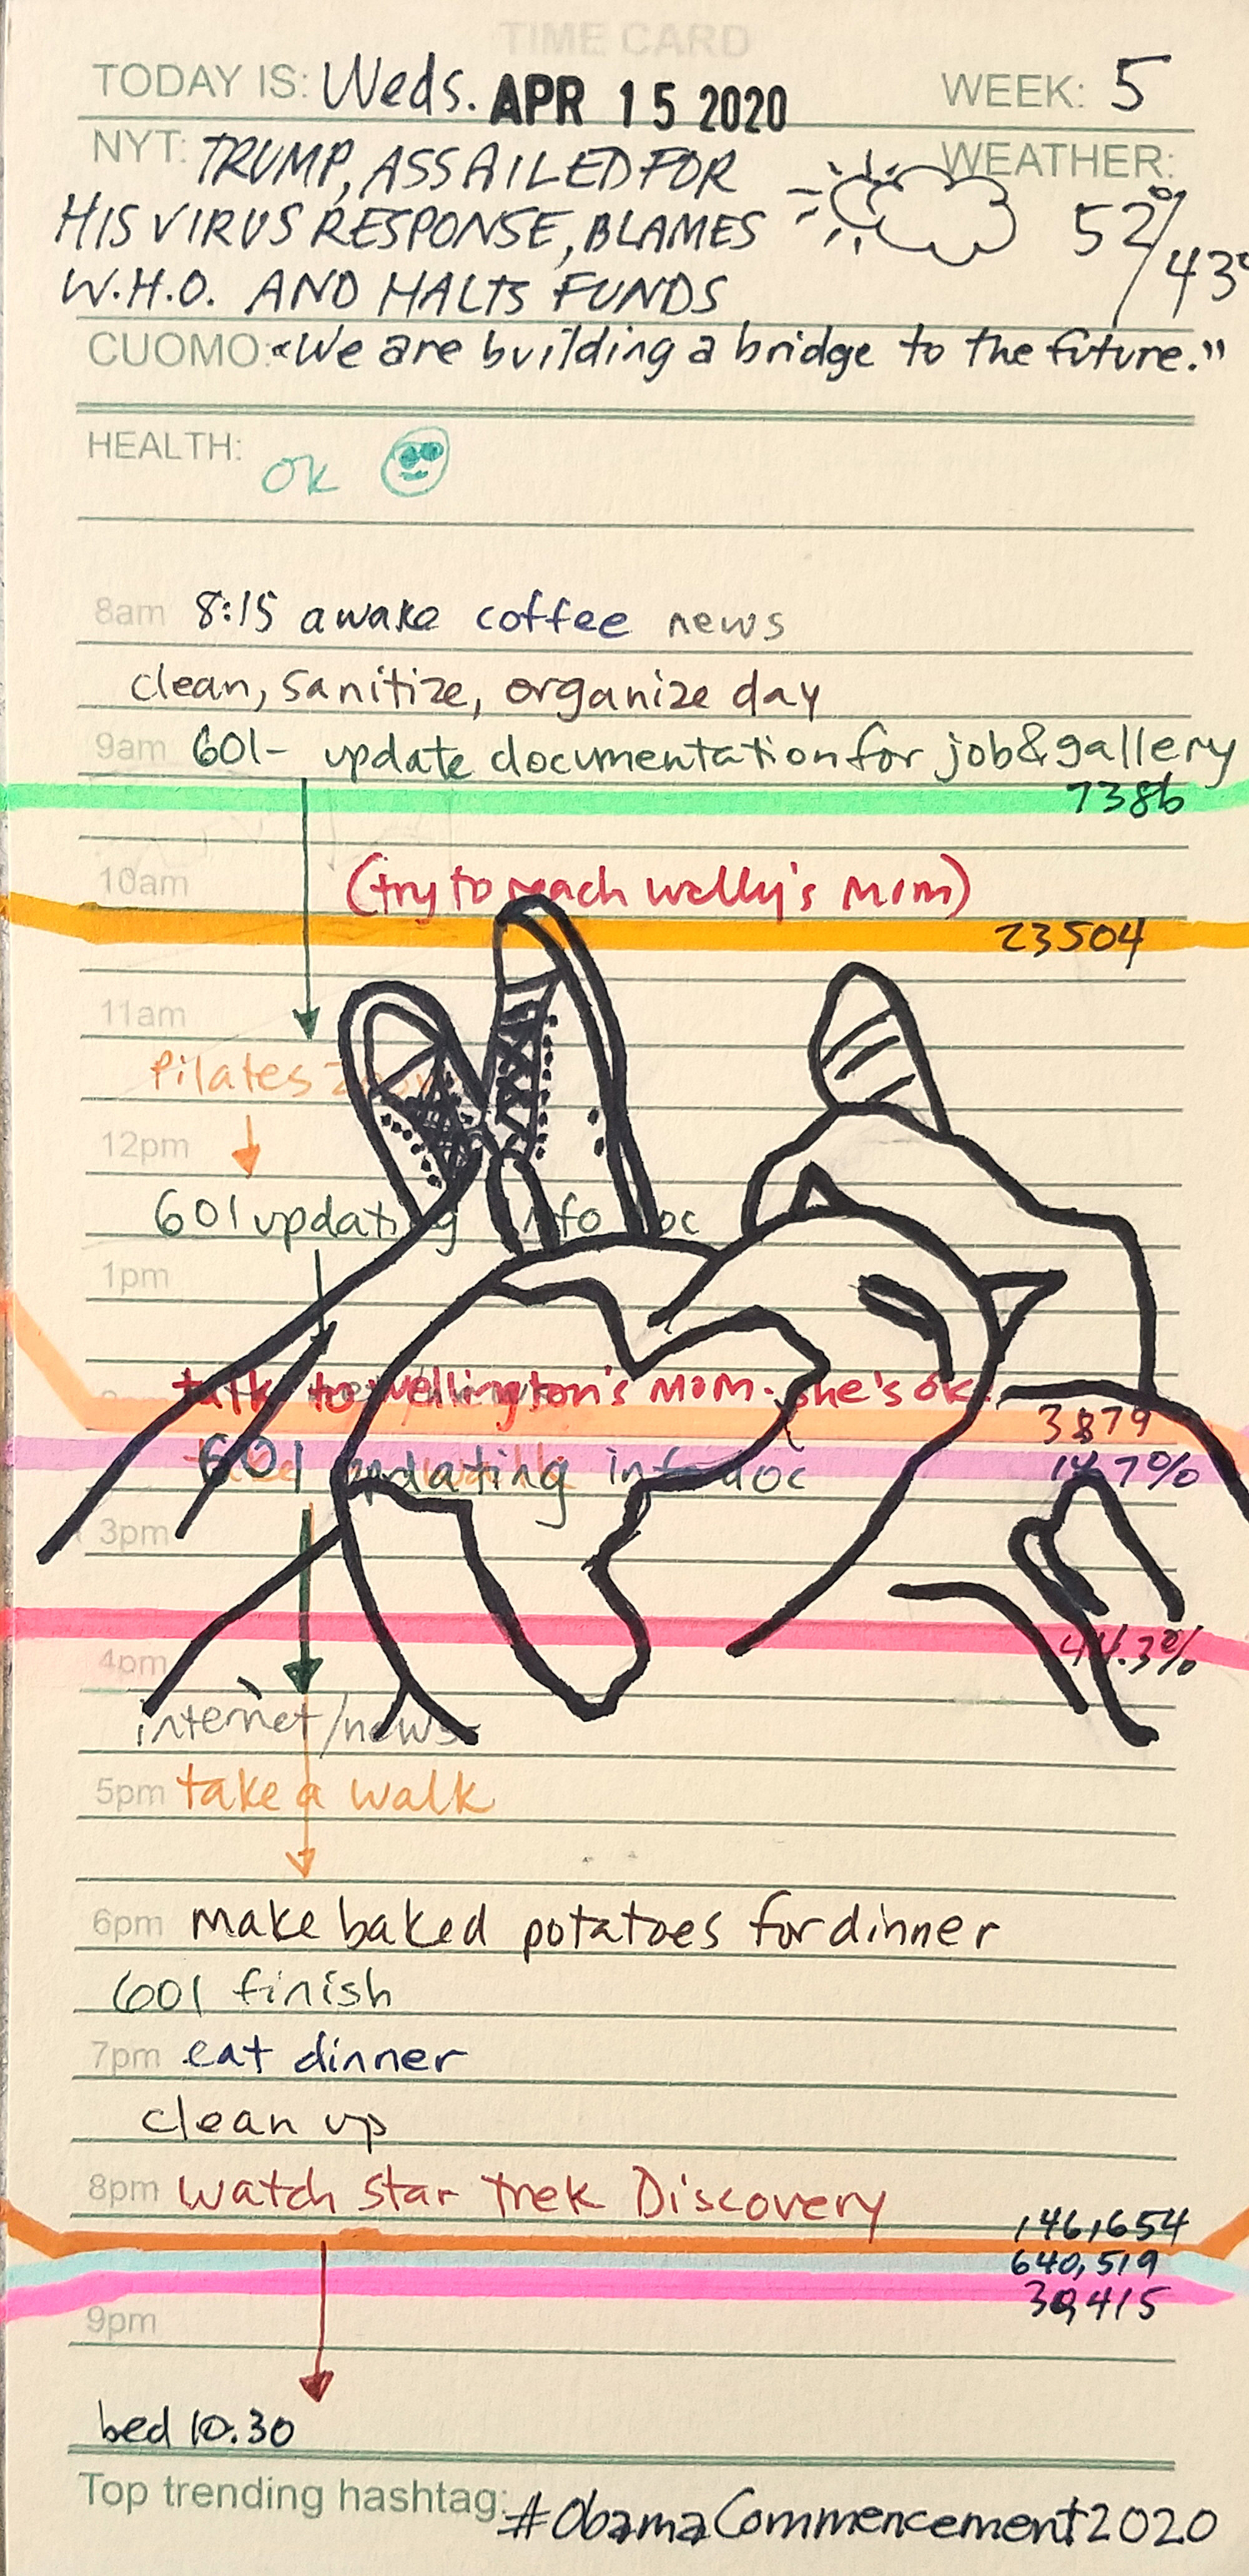
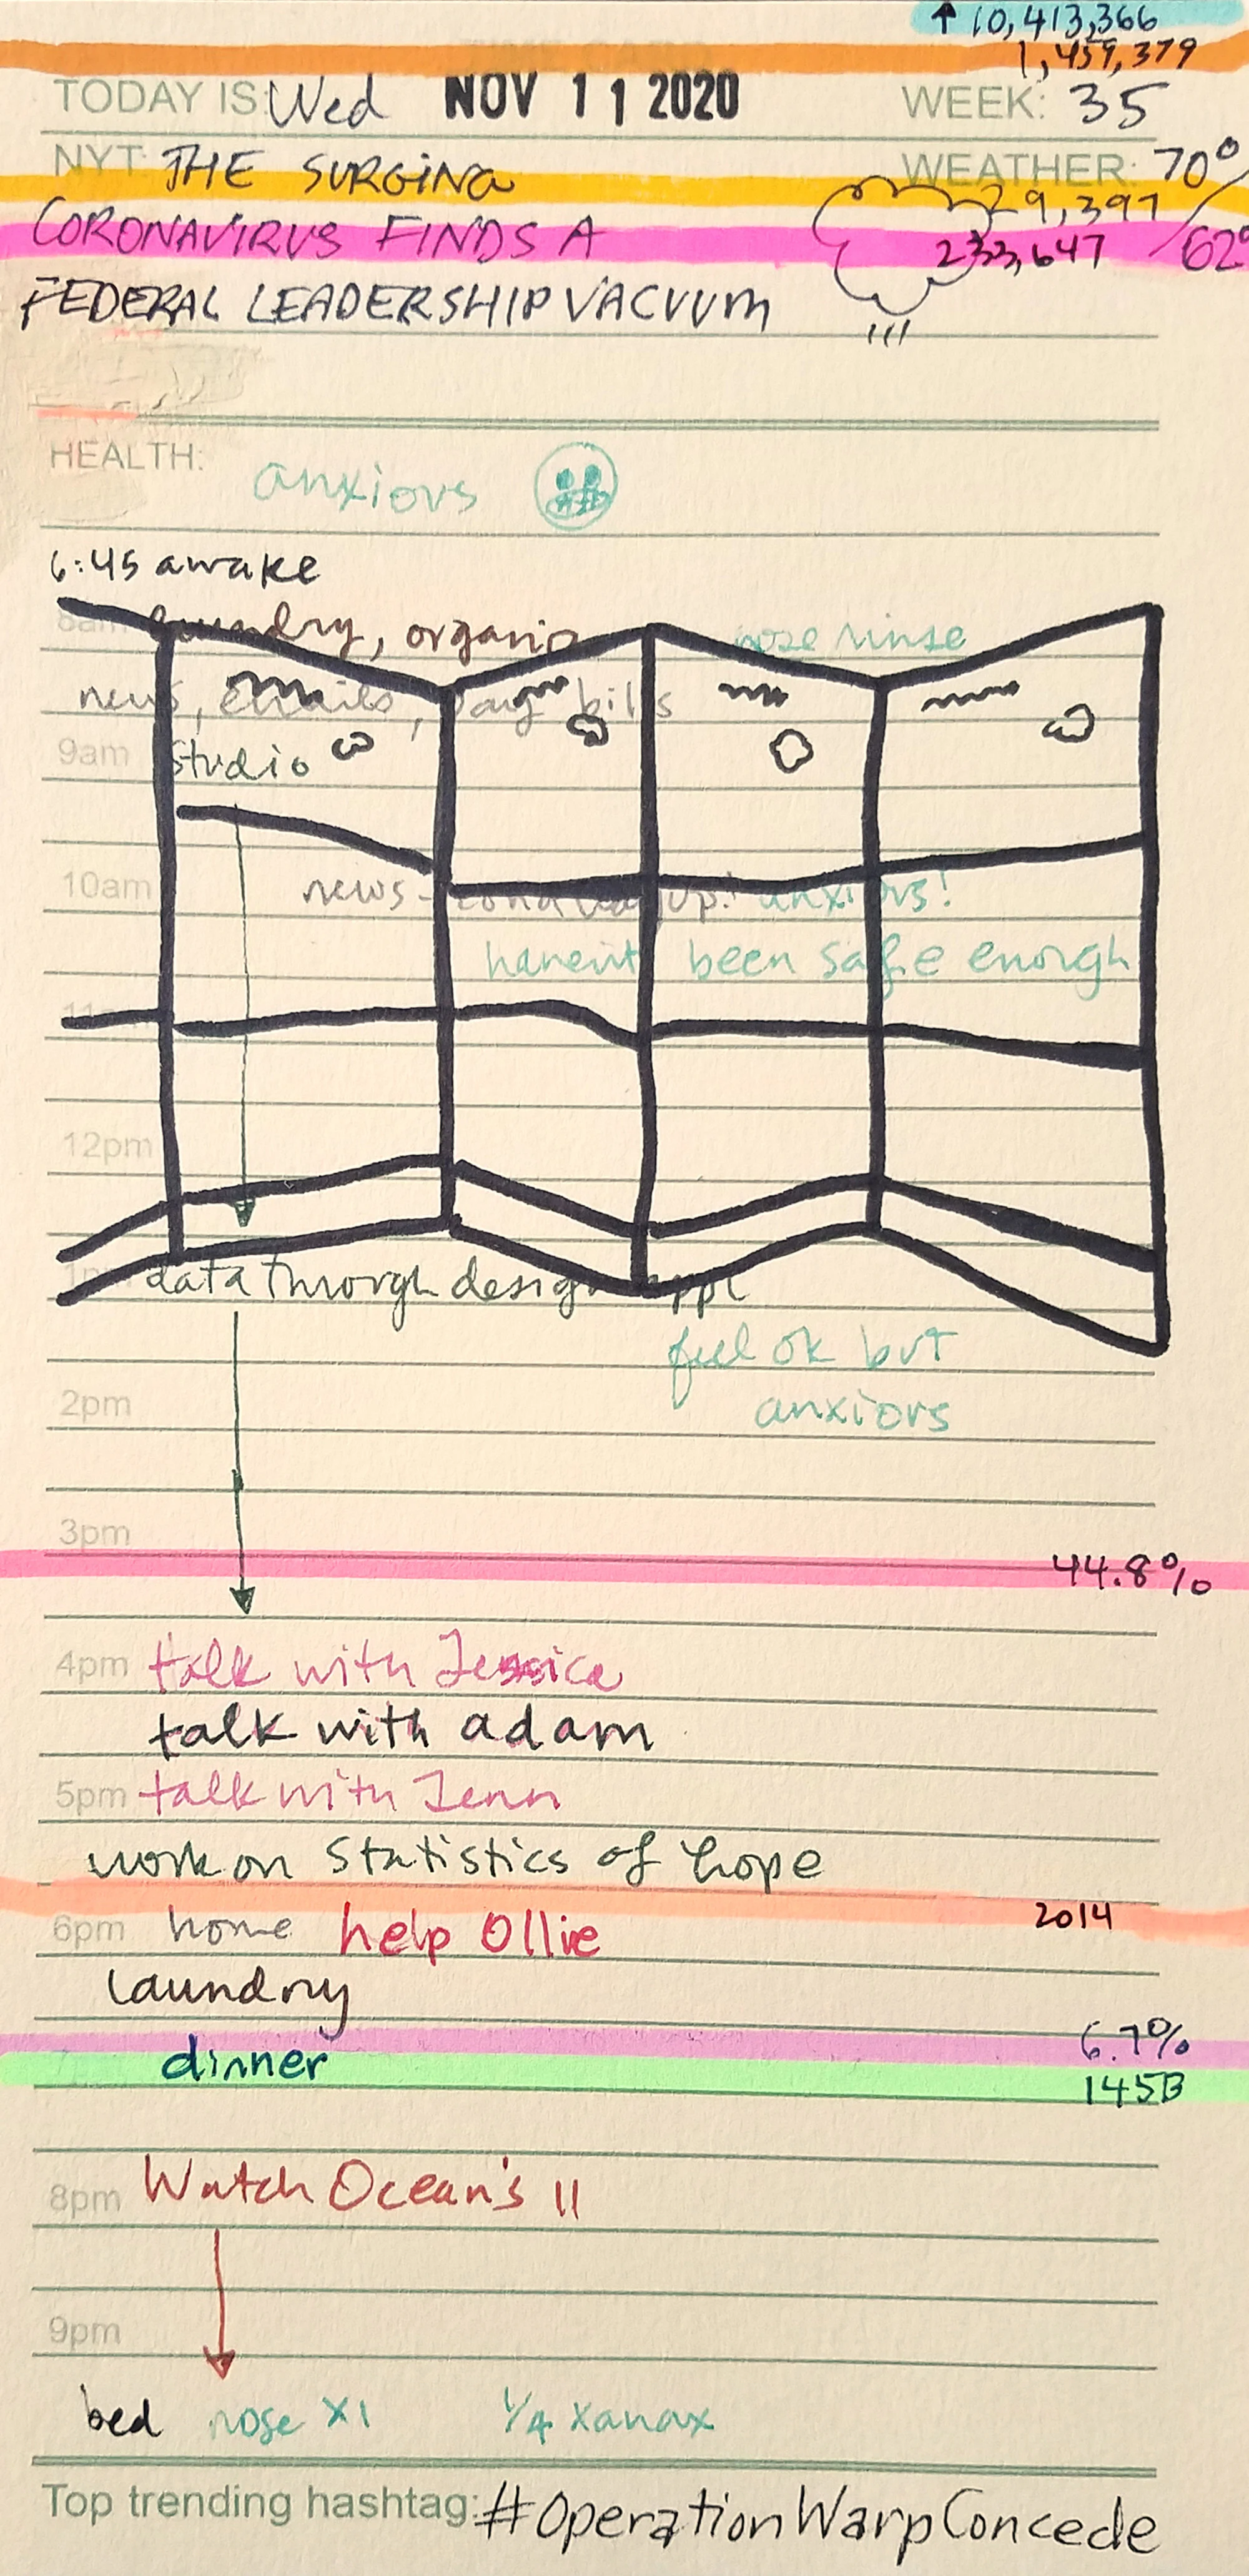
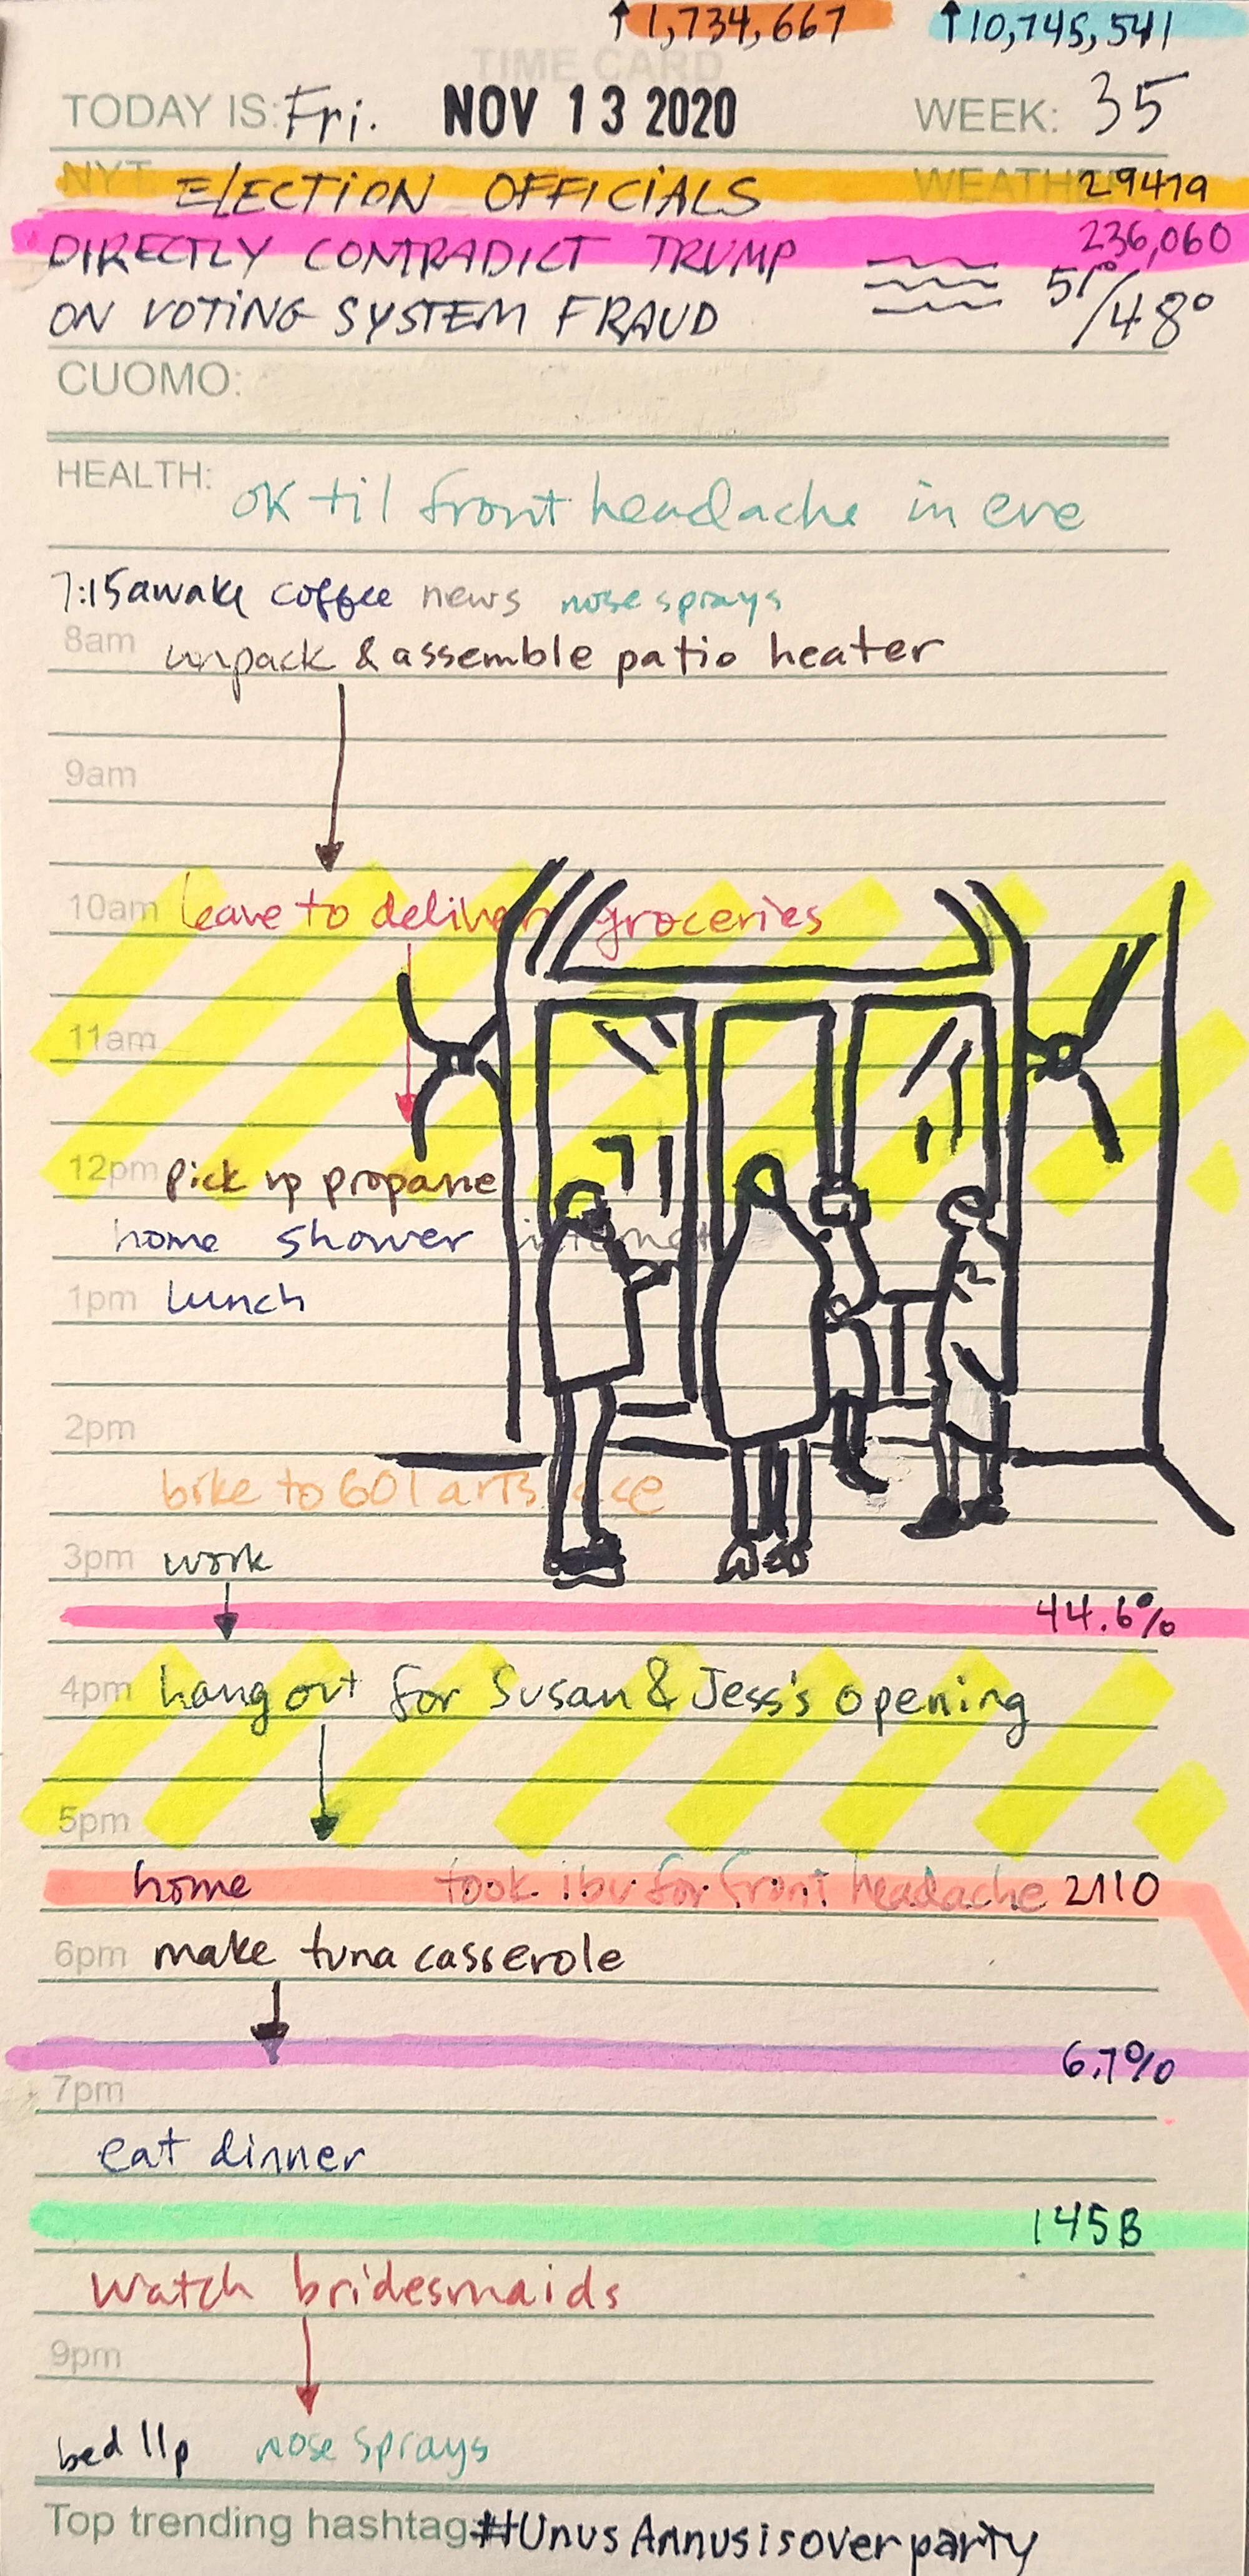
Whether they are explicitly mentioned or not, almost all my time has been spent together with, or within 50 feet of, my dear husband and son.
Part 3: November 1, 2020 - February 28, 2021


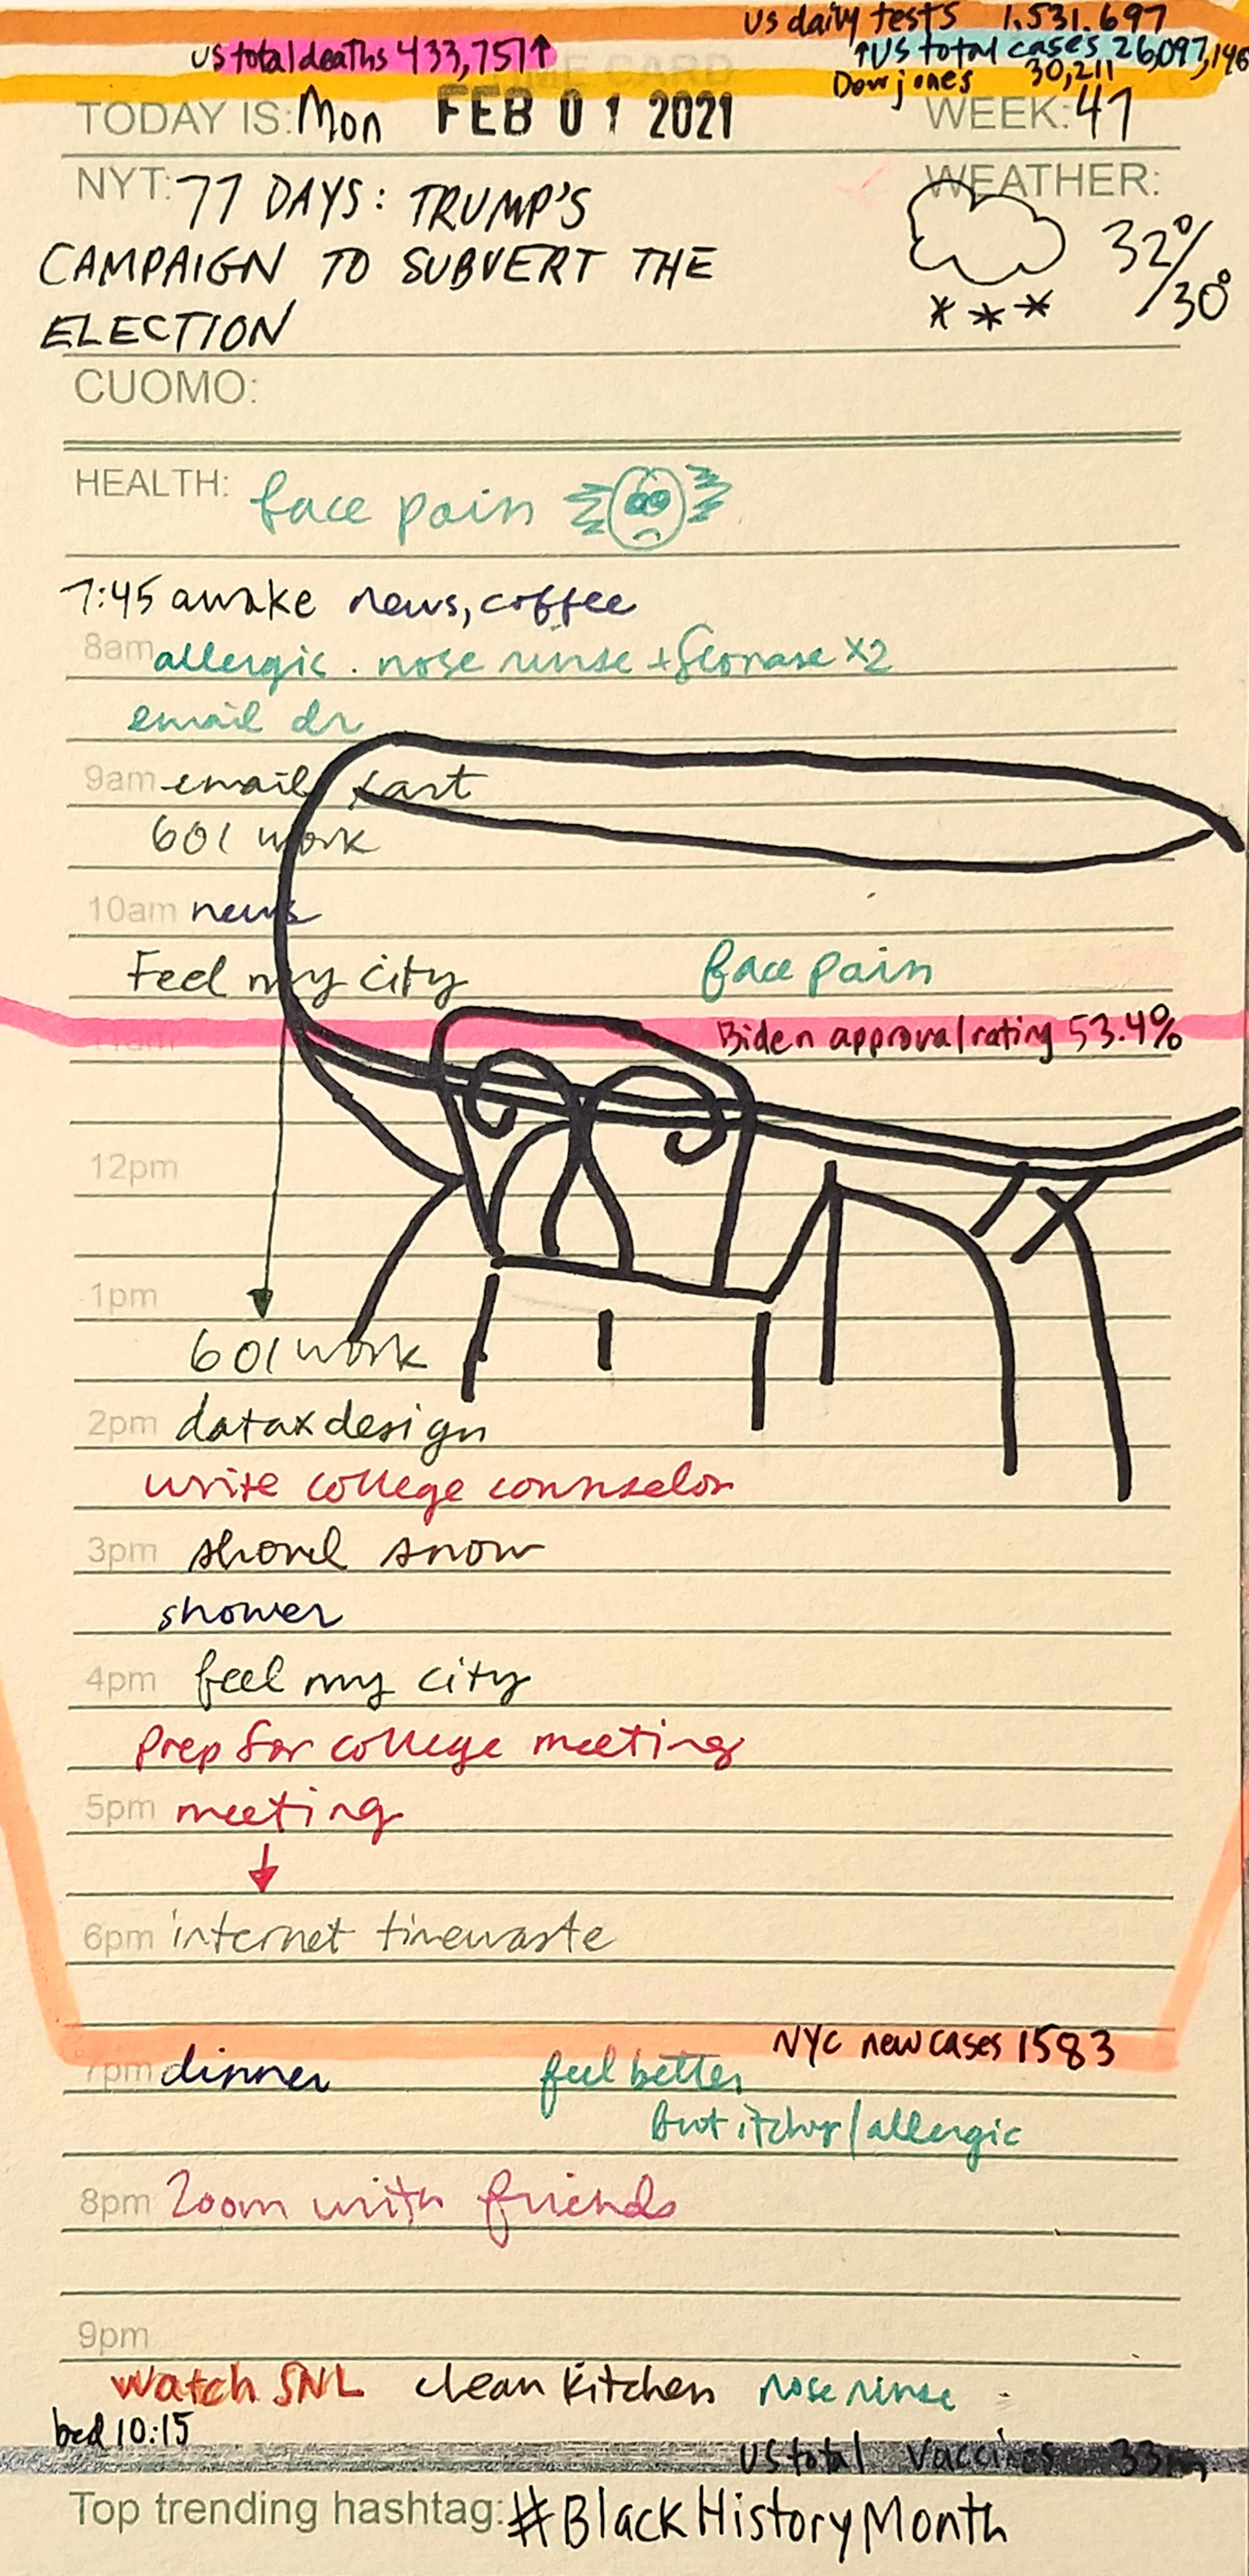


A note on February 2021
Most of the line graph data was not available or complete for Februrary as of March 1, 2021. The data for US daily COVID tests, total cases, vaccines and deaths, and for NYC daily cases are available but not complete. I’ve shown the provisional numbers but they will be revised upwards.
Some graphs eventually extend off the top of the page because when I started the project I wrongly estimated how far things would go. When I started logging I planned for the project to last 3 months to encompass the entire crisis.